Real screenshots from SnowOps Intelligence running inside Snowflake. Every view built for dark mode. 30+ screens across every feature.
30+ screenshots • 8 feature categories • 100% real product
Your operational headquarters. KPI cards for credits, efficiency scores, warehouse health, and data freshness — all at a glance.
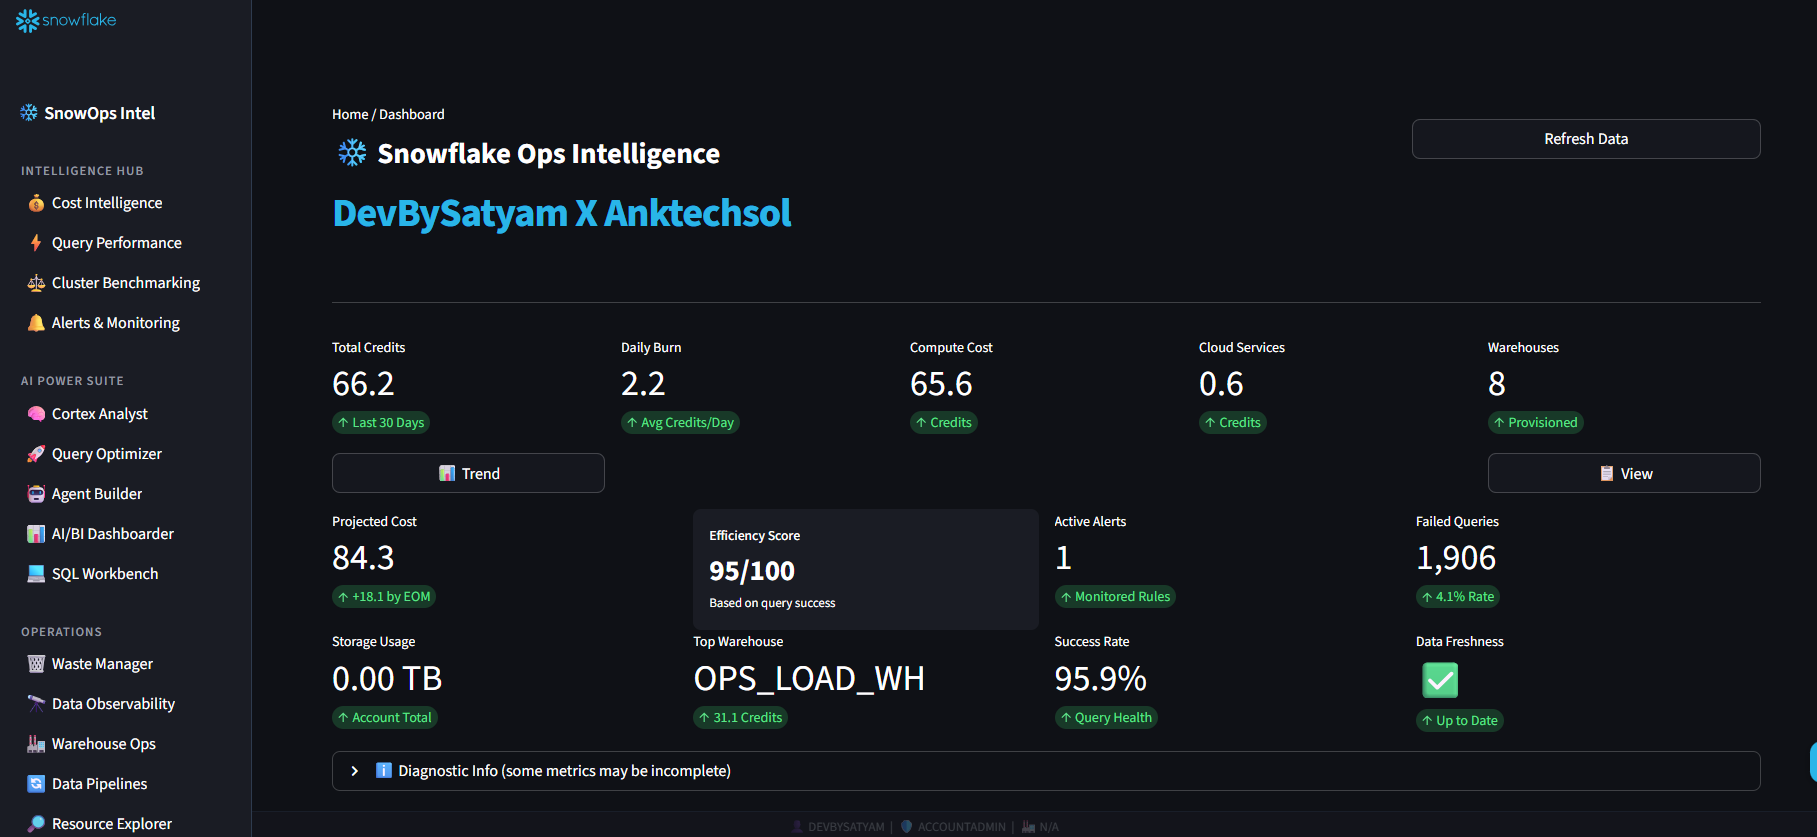
Total credits, daily burn rate, efficiency score, active alerts, failed queries, and top warehouse — all updated in real time with one-click refresh.
streamlit_app.py → Home
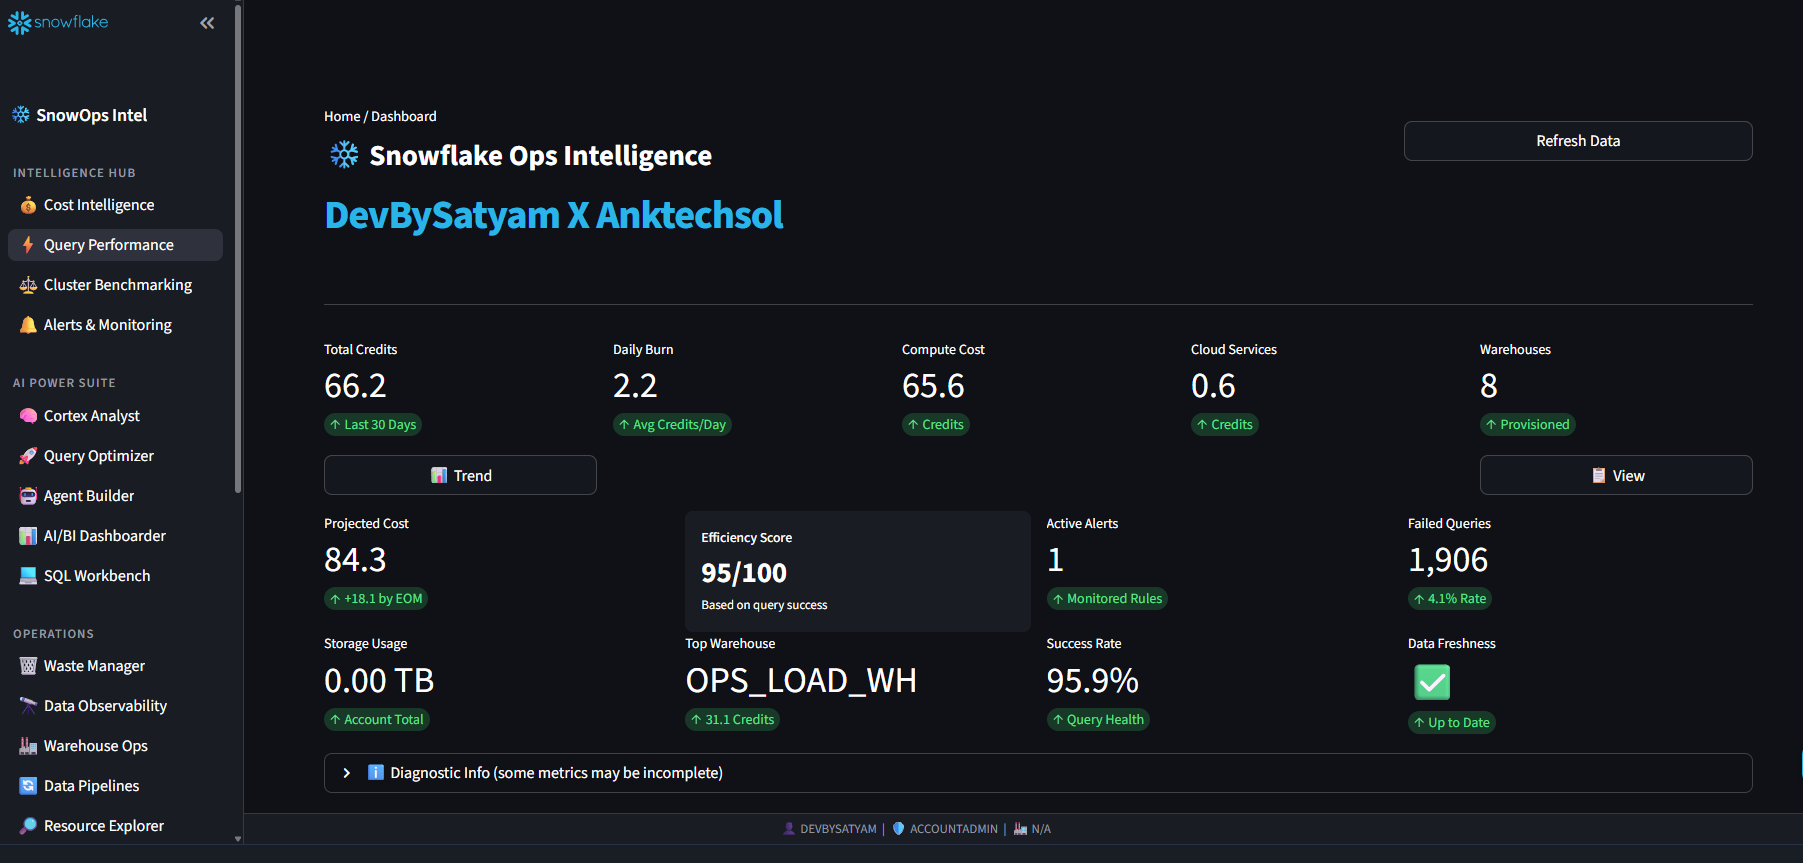
Intelligence Hub, AI Power Suite, and Operations modules — organized for fast access to every feature.
19+ modules
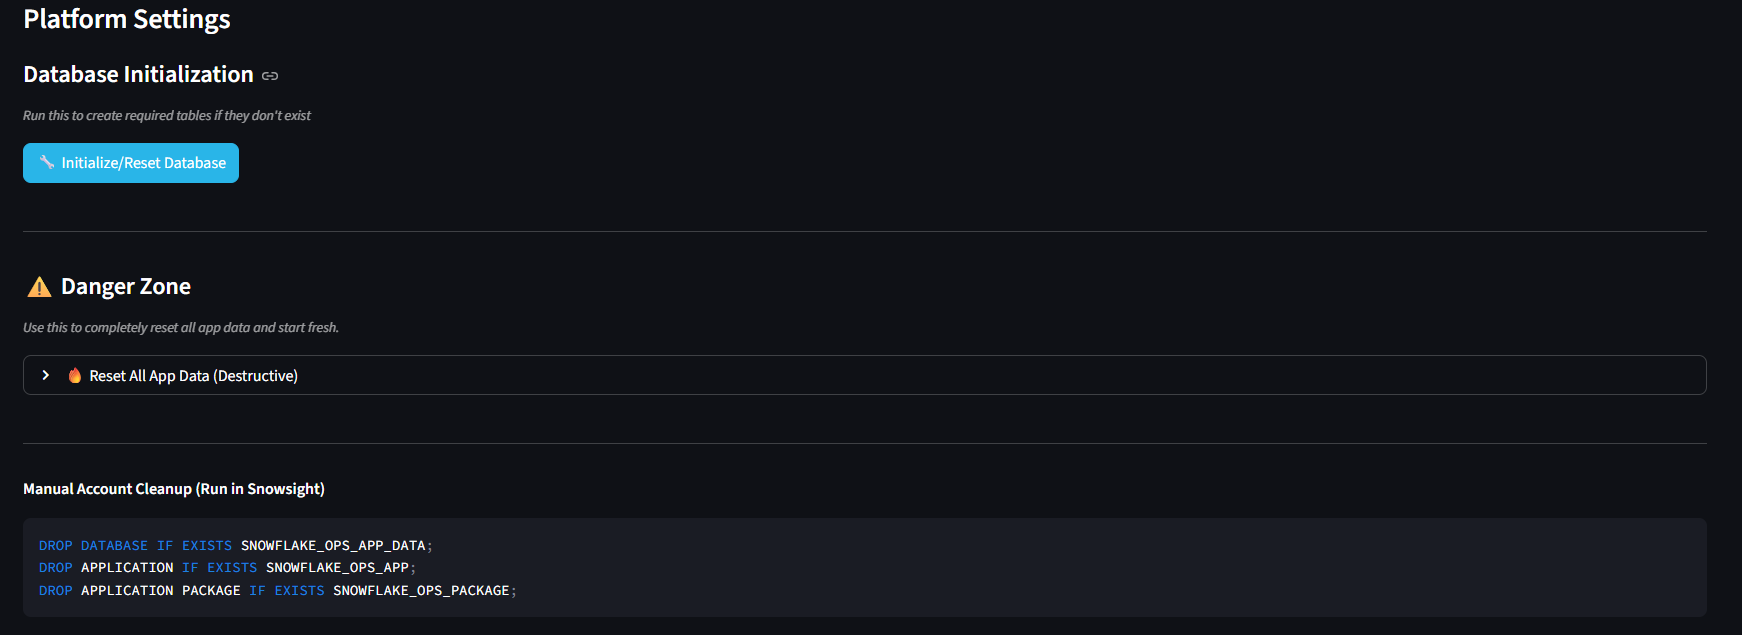
Configure telemetry, PostHog keys, warehouse defaults, and refresh intervals from the admin panel.
settings.py15 sub-tabs covering overview, warehouse metering, ingestion, user and role attribution, anomaly detection, dbt models, and forecasting.
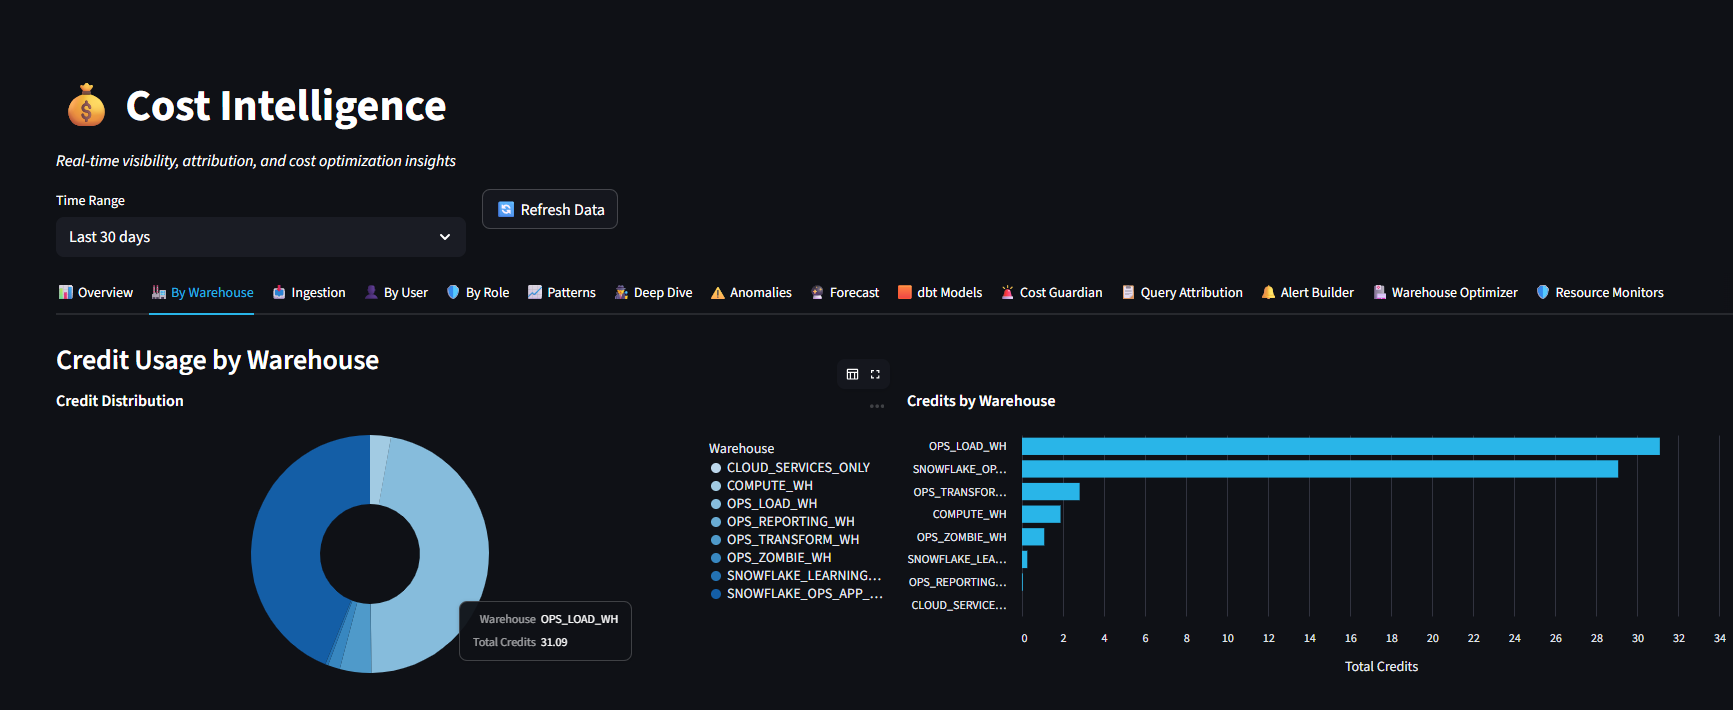
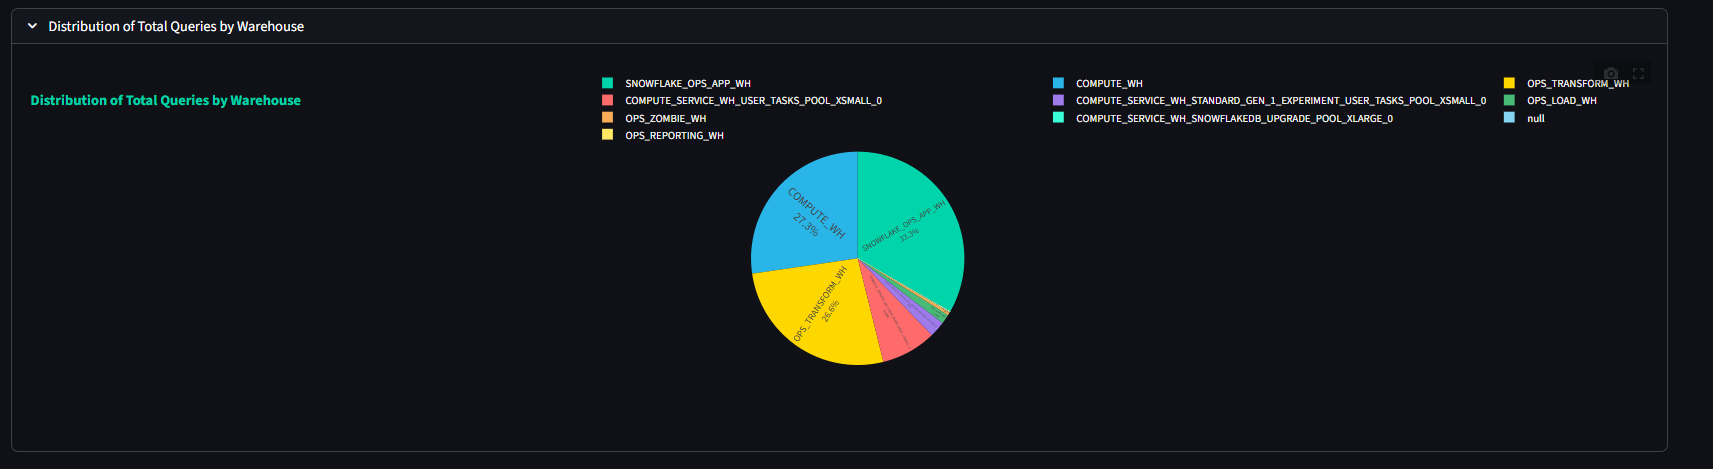
Donut chart and horizontal bar chart showing credit distribution across all warehouses. Interactive tooltips reveal exact credit counts.
1_cost.py → By Warehouse
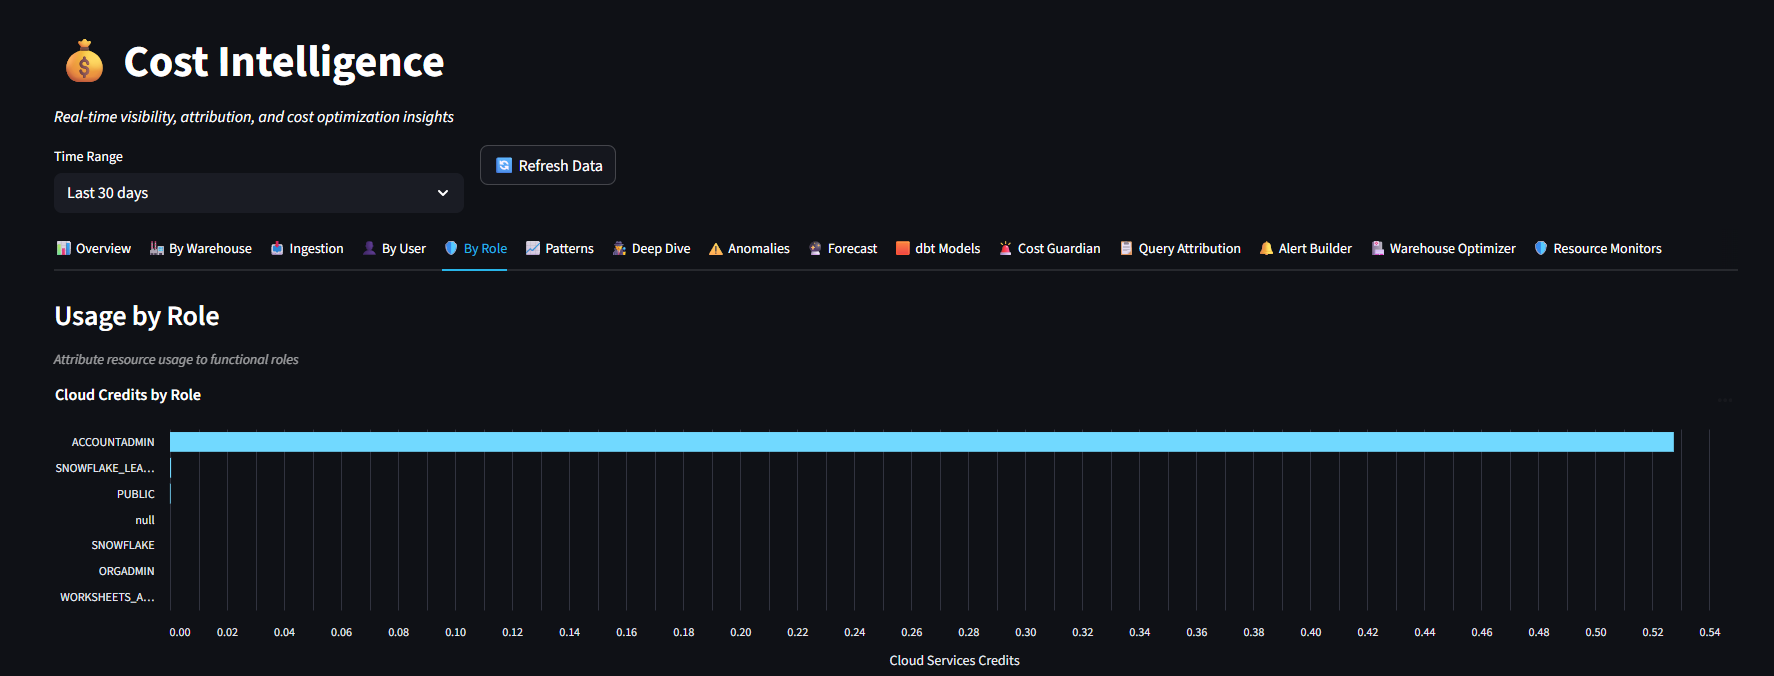
Attribute credit consumption to specific Snowflake roles. Identify which roles drive the most compute spend.
1_cost.py → By Role
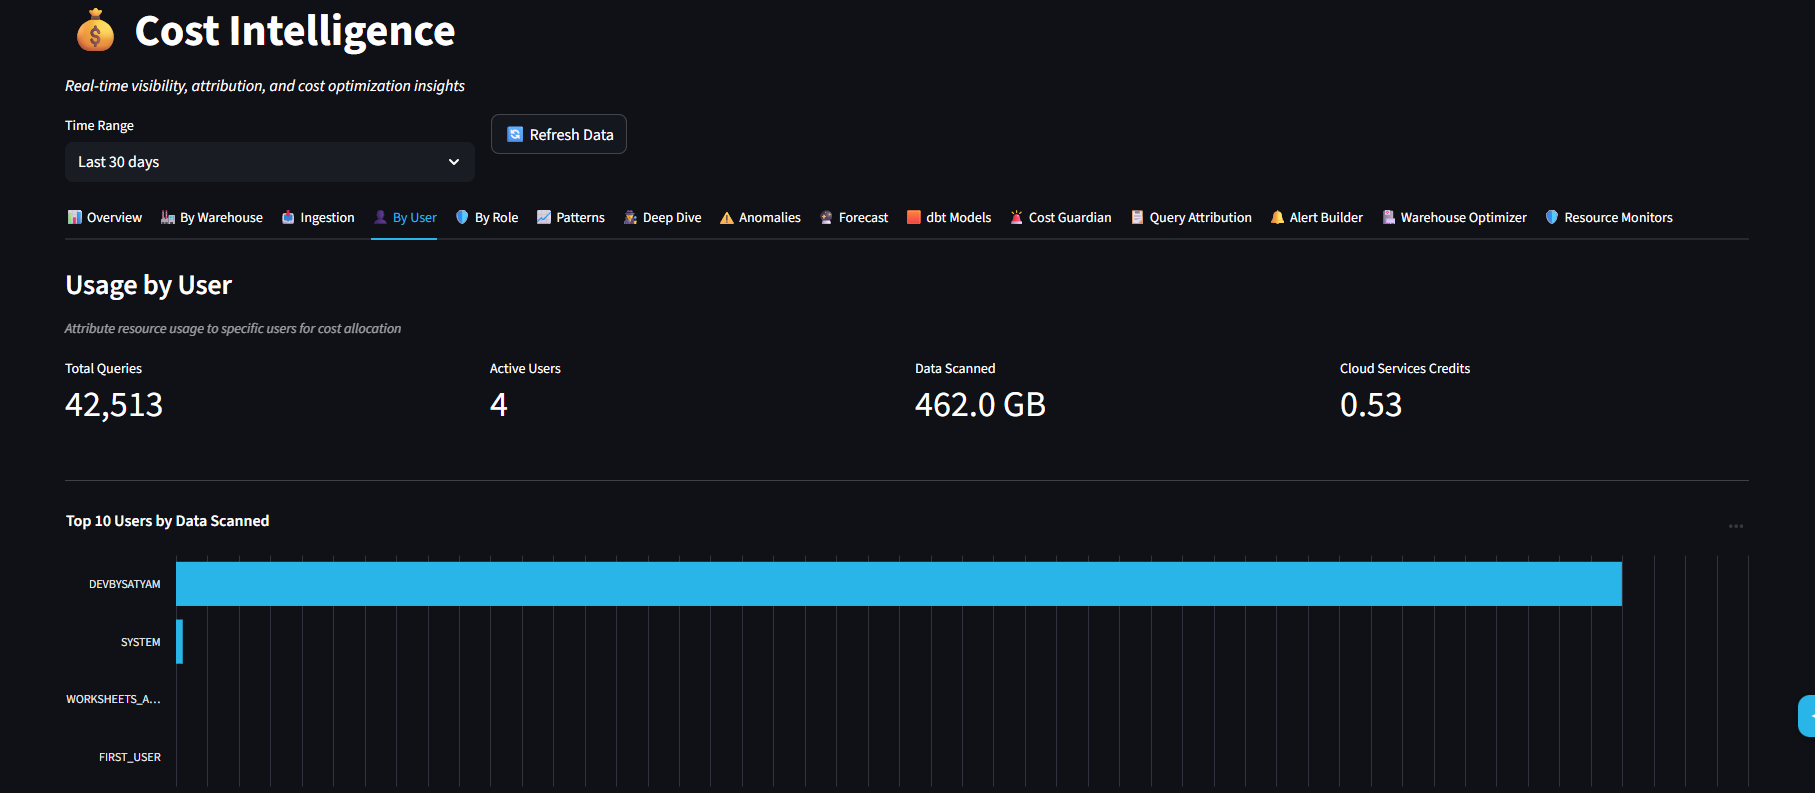
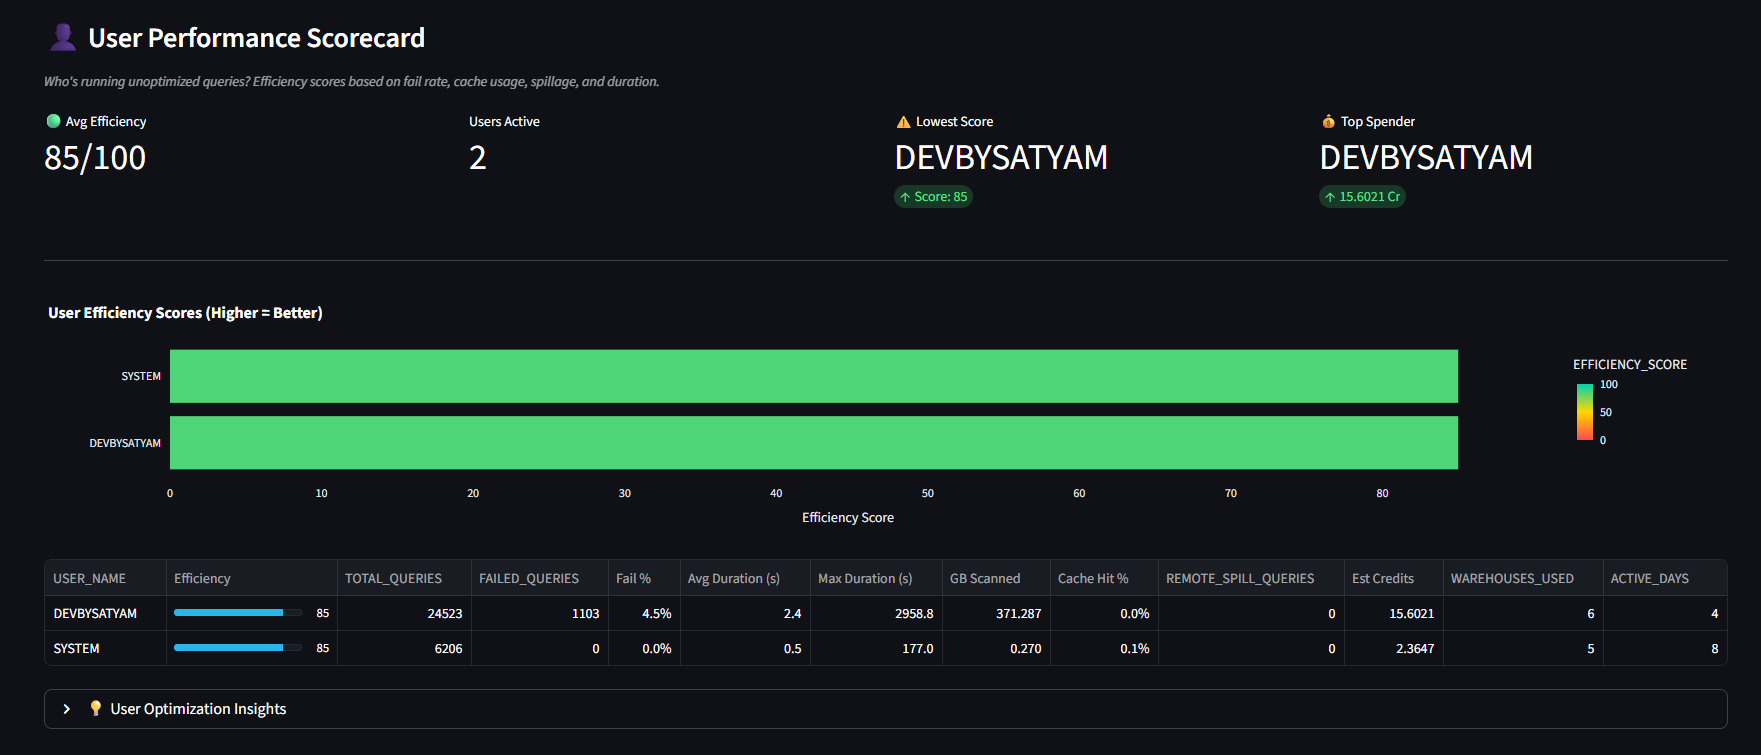
User-level credit attribution with query counts and estimated costs. Track individual consumption patterns.
1_cost.py → By User
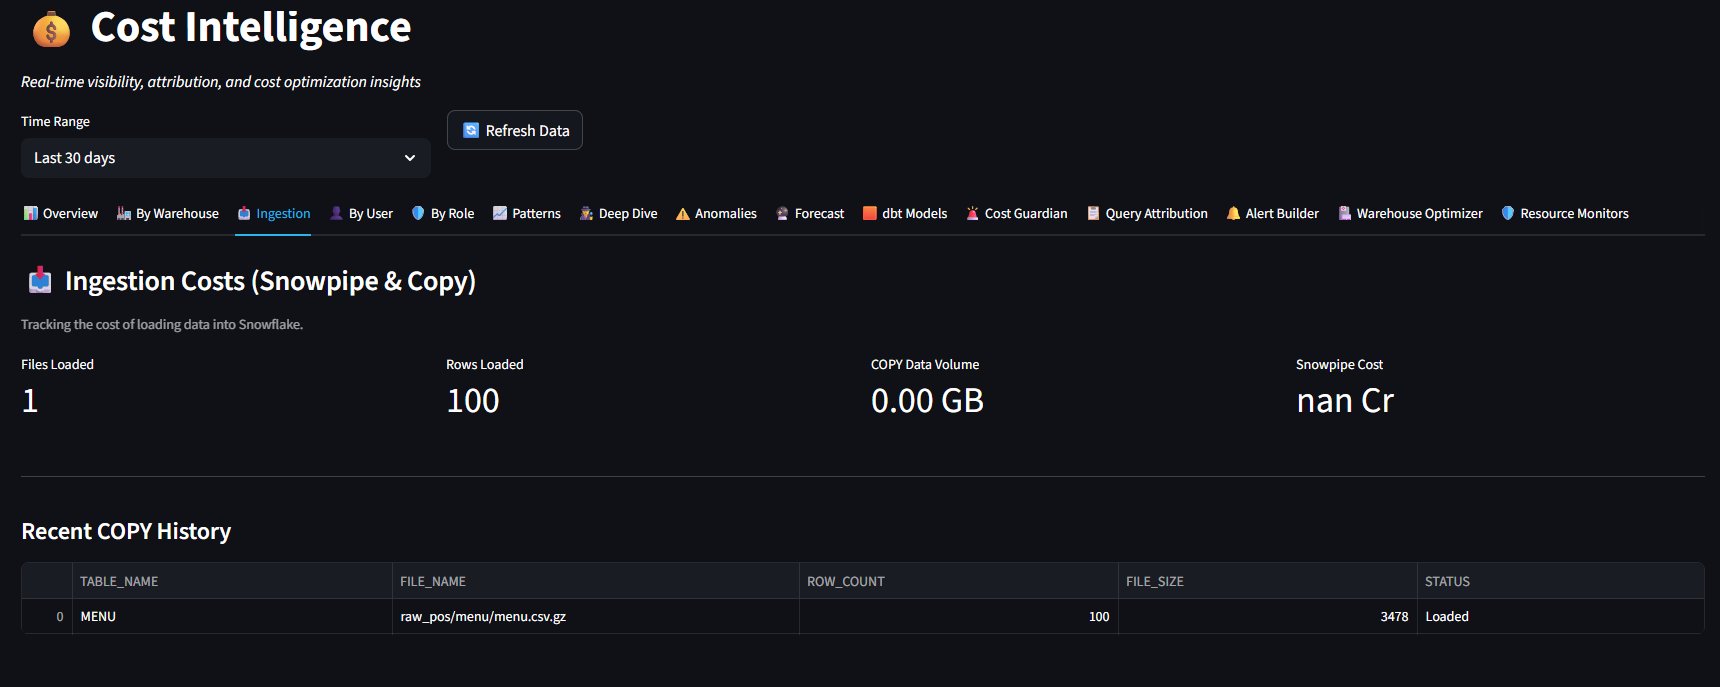
Monitor data loading costs across pipes and stages.
1_cost.py → Ingestion
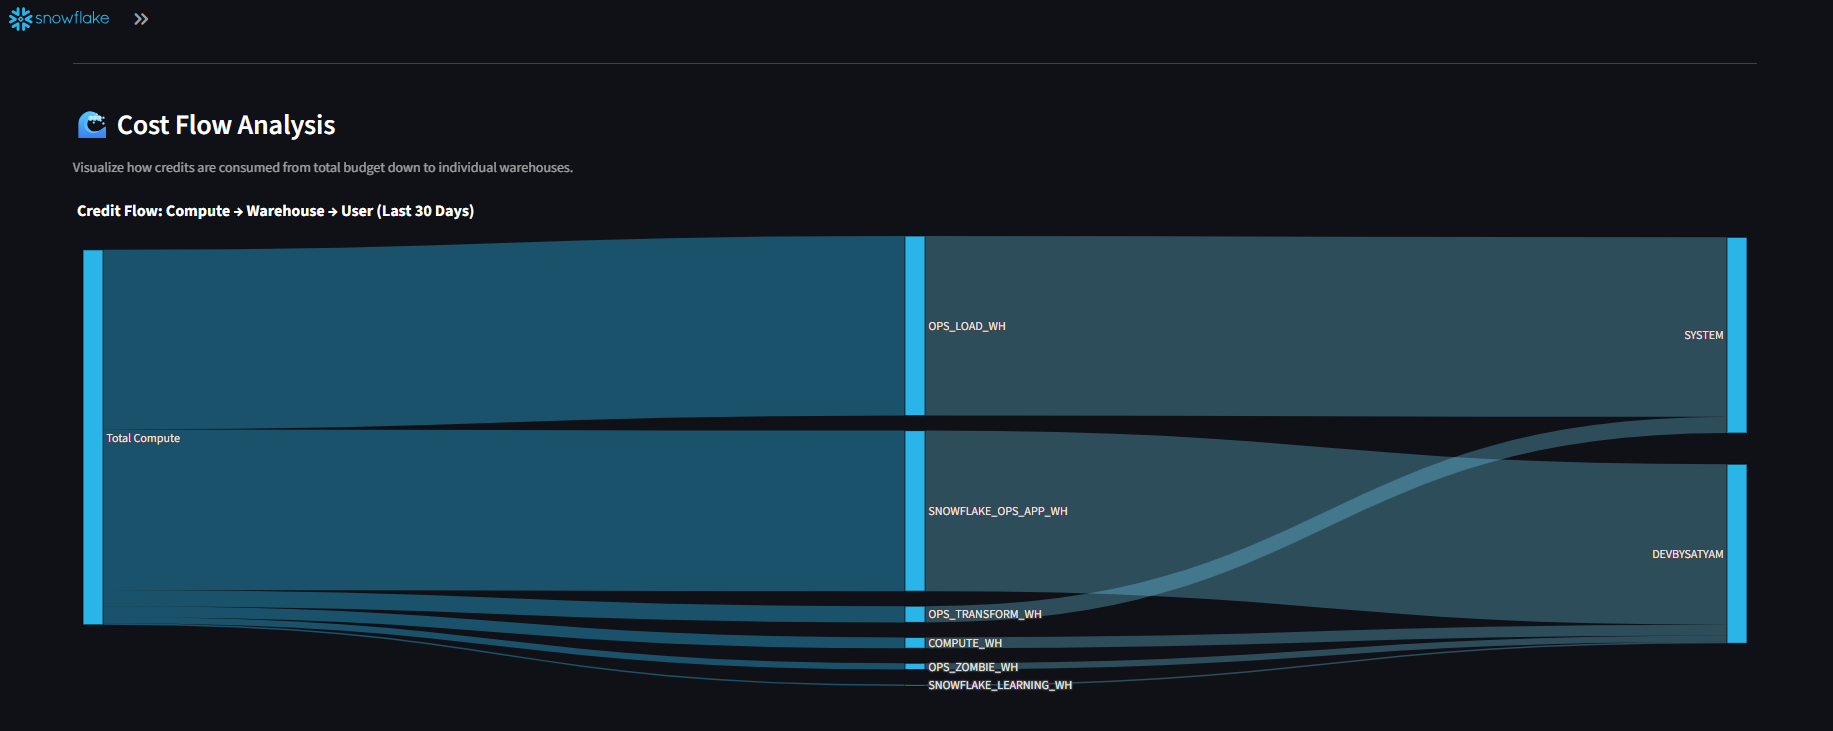
Sankey flow diagram: Compute → Warehouse → User credit mapping.
1_cost.py → Deep Dive
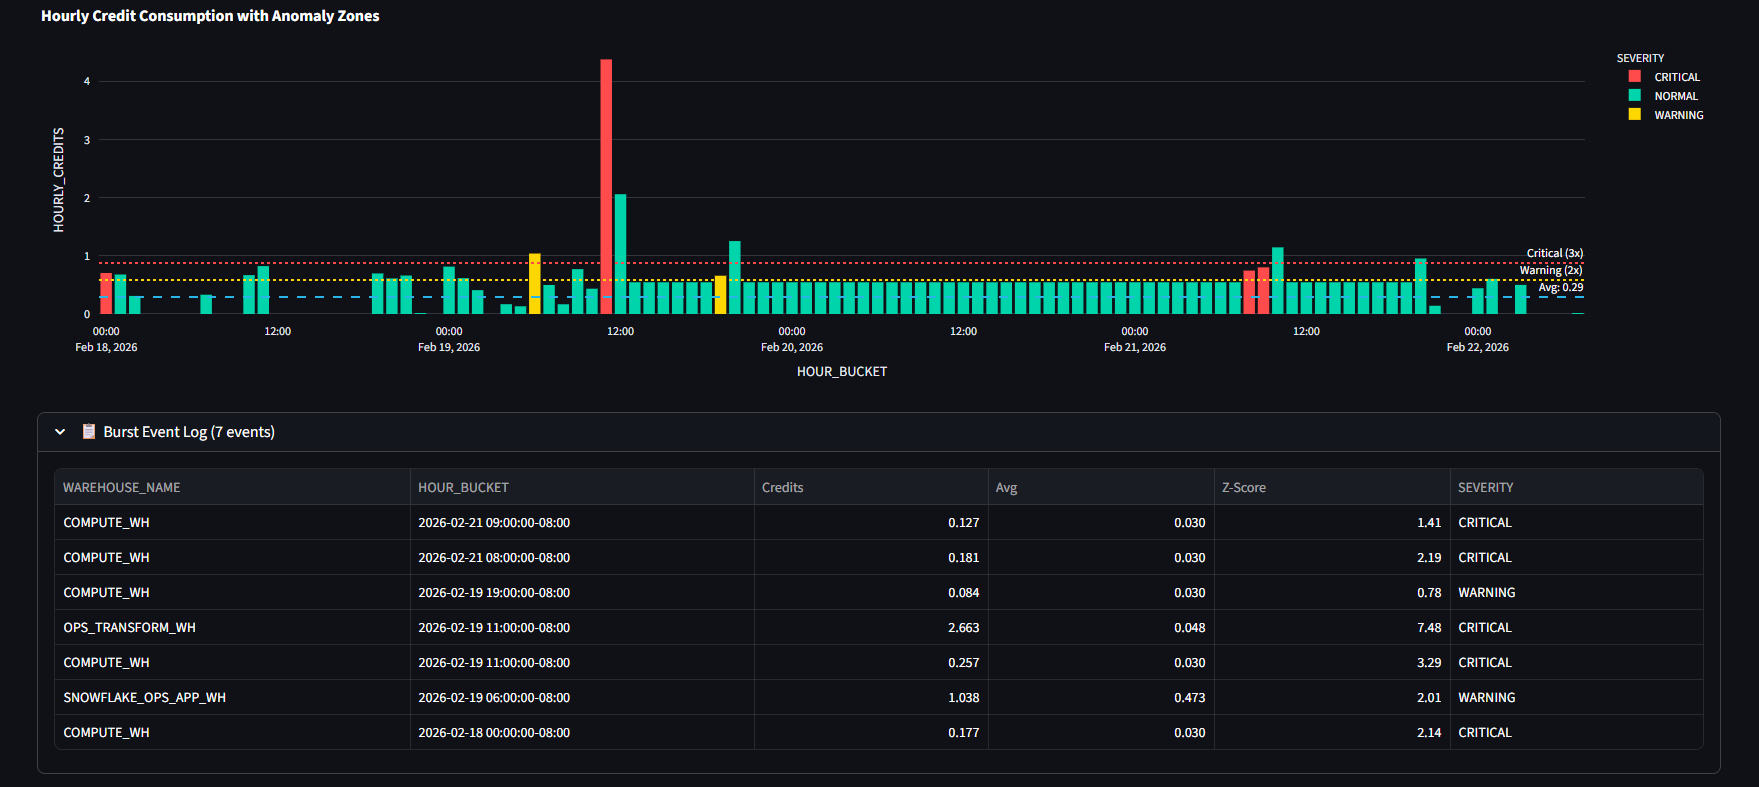
Hourly credit consumption with anomaly zones. Z-score based burst detection with CRITICAL/WARNING severity levels.
1_cost.py → Anomalies
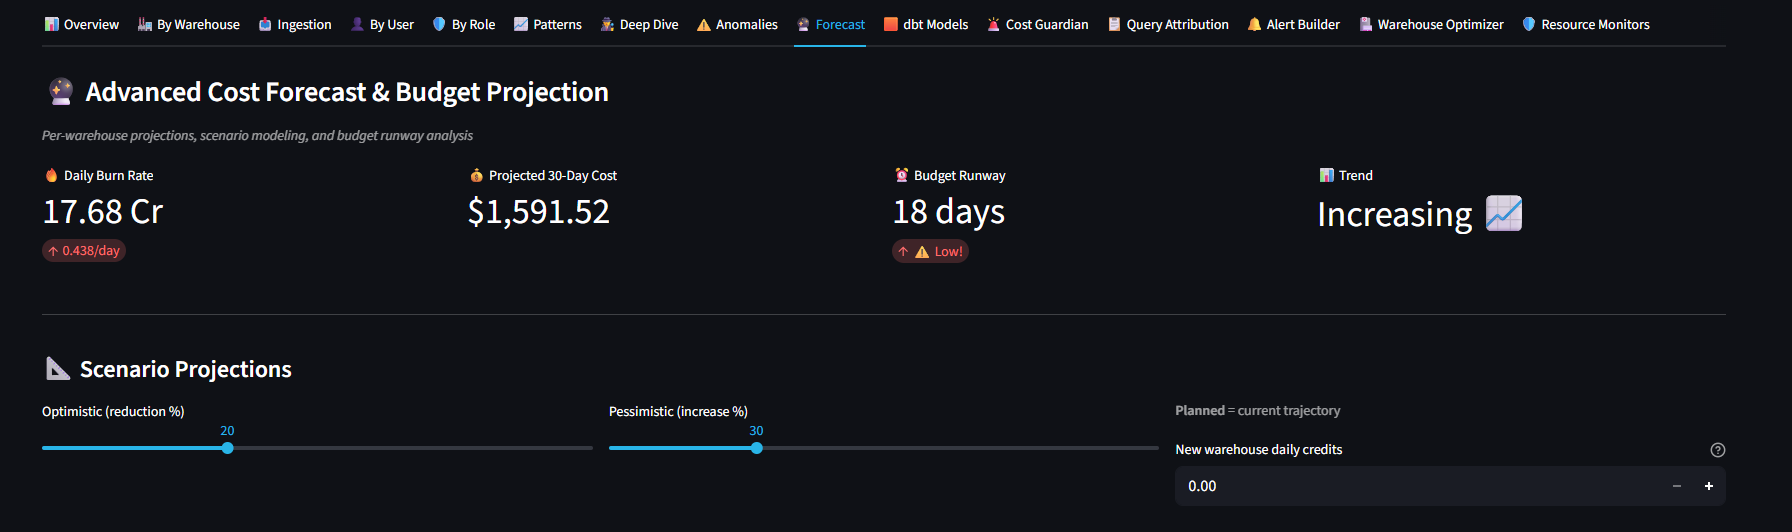
Monthly budget runway projections using planned or pessimistic consumption rates.
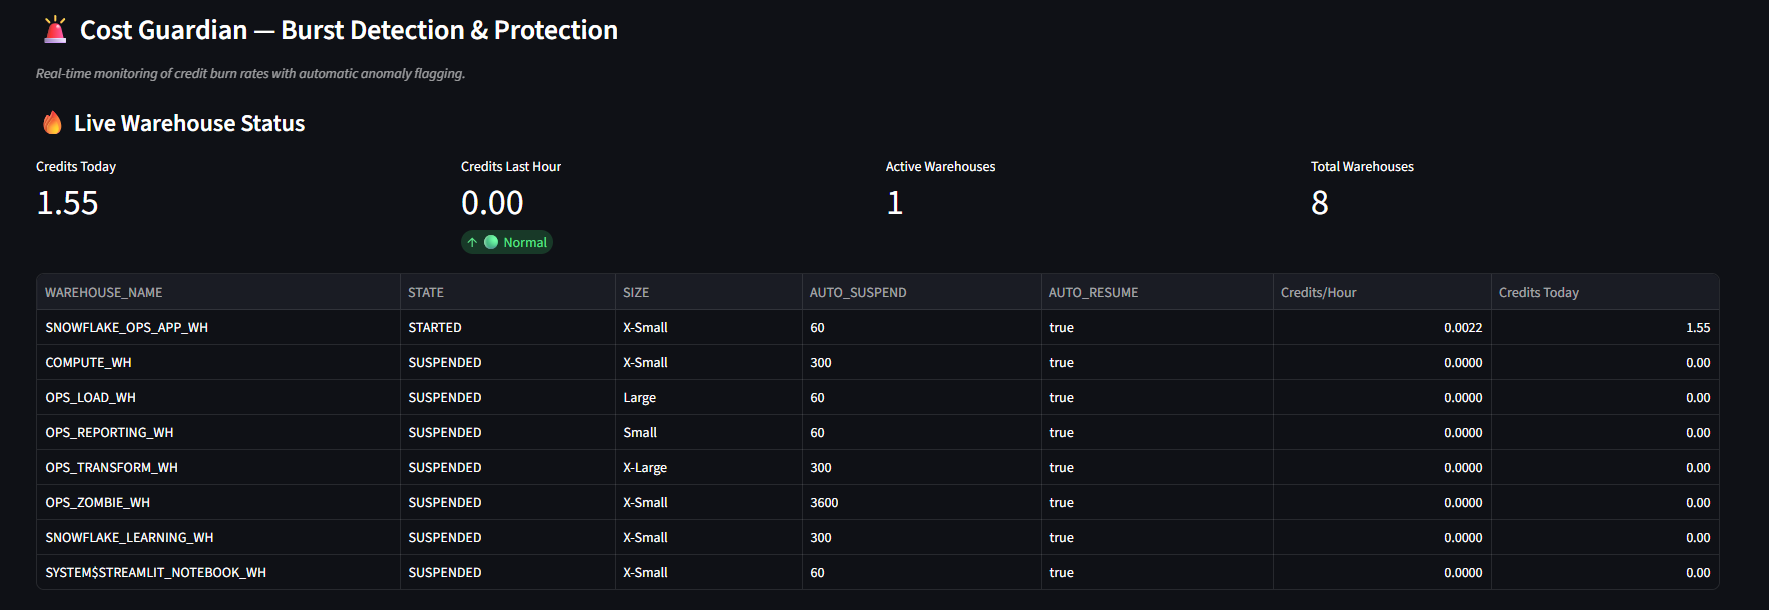
1_cost.py → ForecastReal-time monitoring of credit burn rates with automatic anomaly flagging. Kills runaway workloads before they drain your budget.
Credits today, credits last hour, active warehouses, auto-suspend configs, and per-warehouse credit/hour burn rates in a real-time table.
1_cost.py → Cost GuardianTop workloads, query attribution, slow query analysis, failed queries, and storage intelligence.
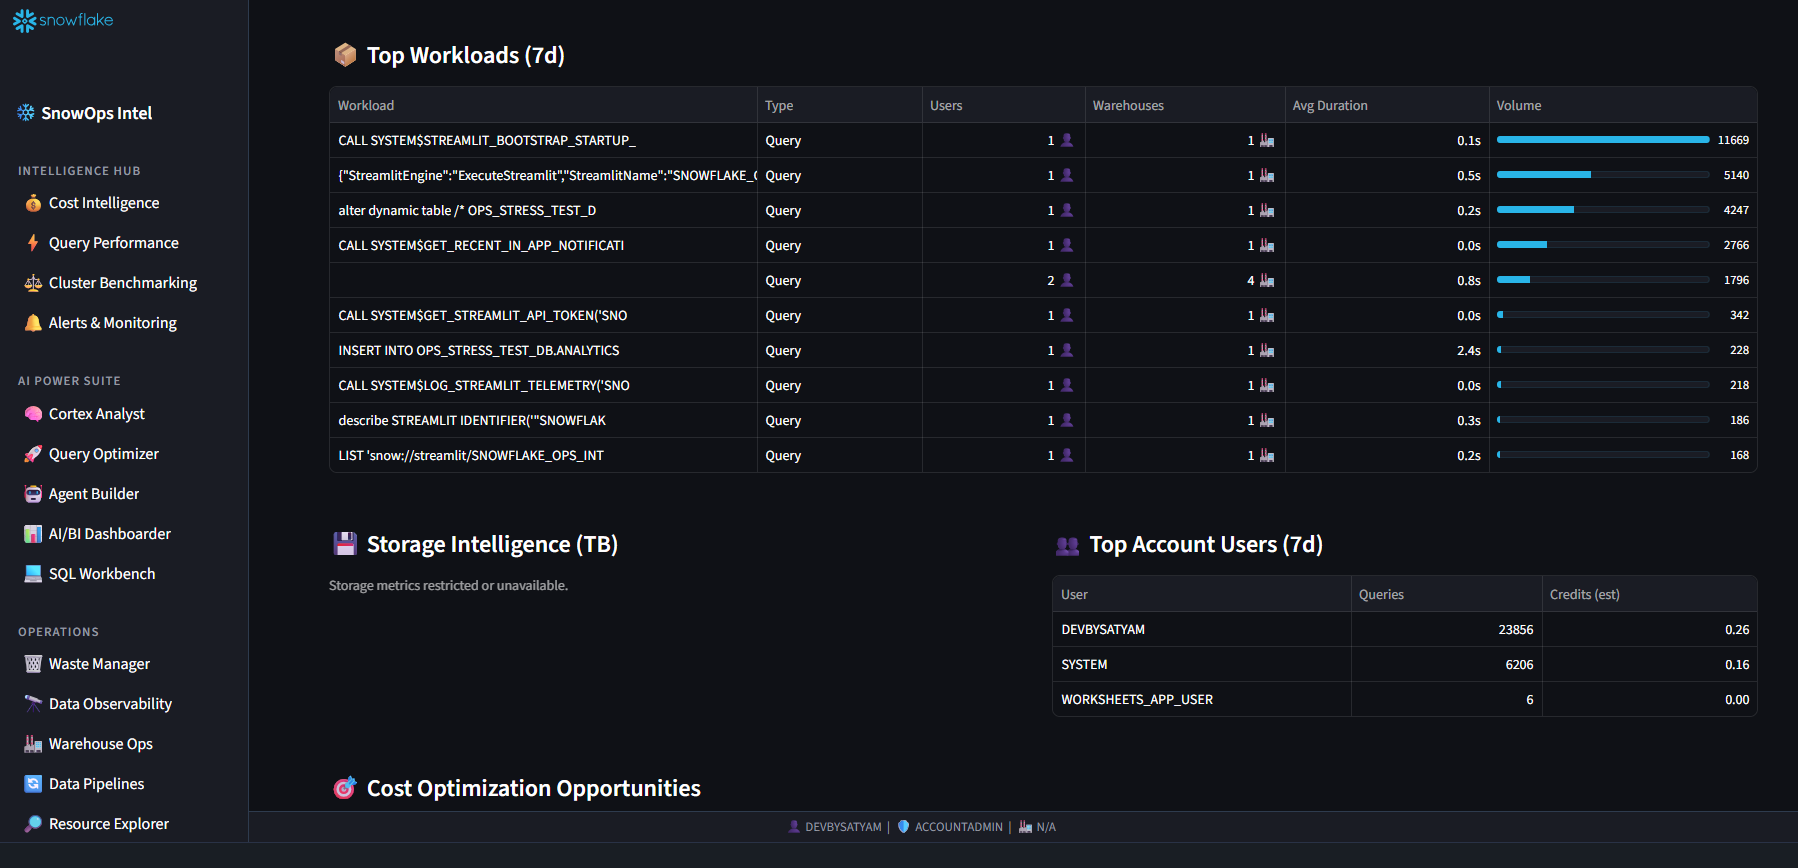
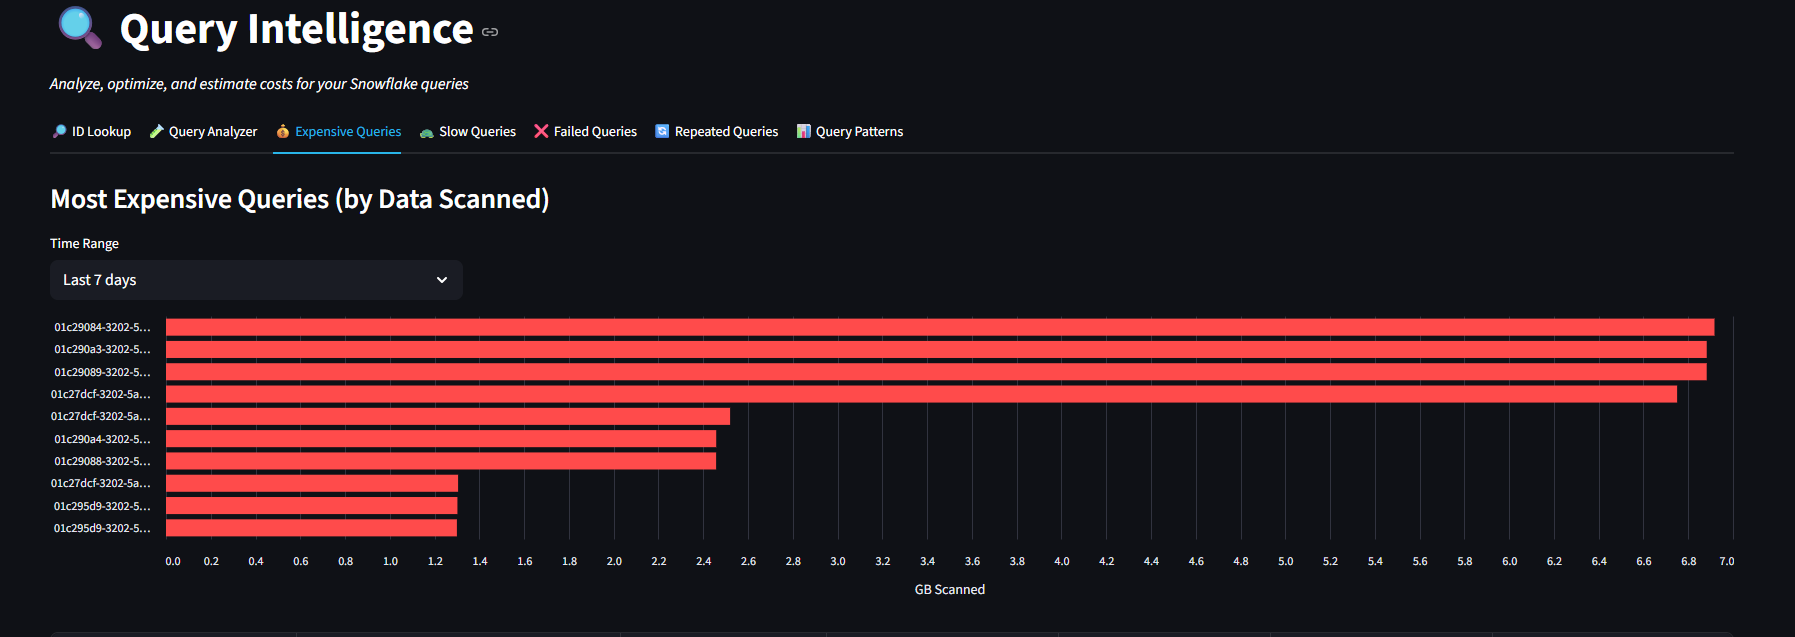
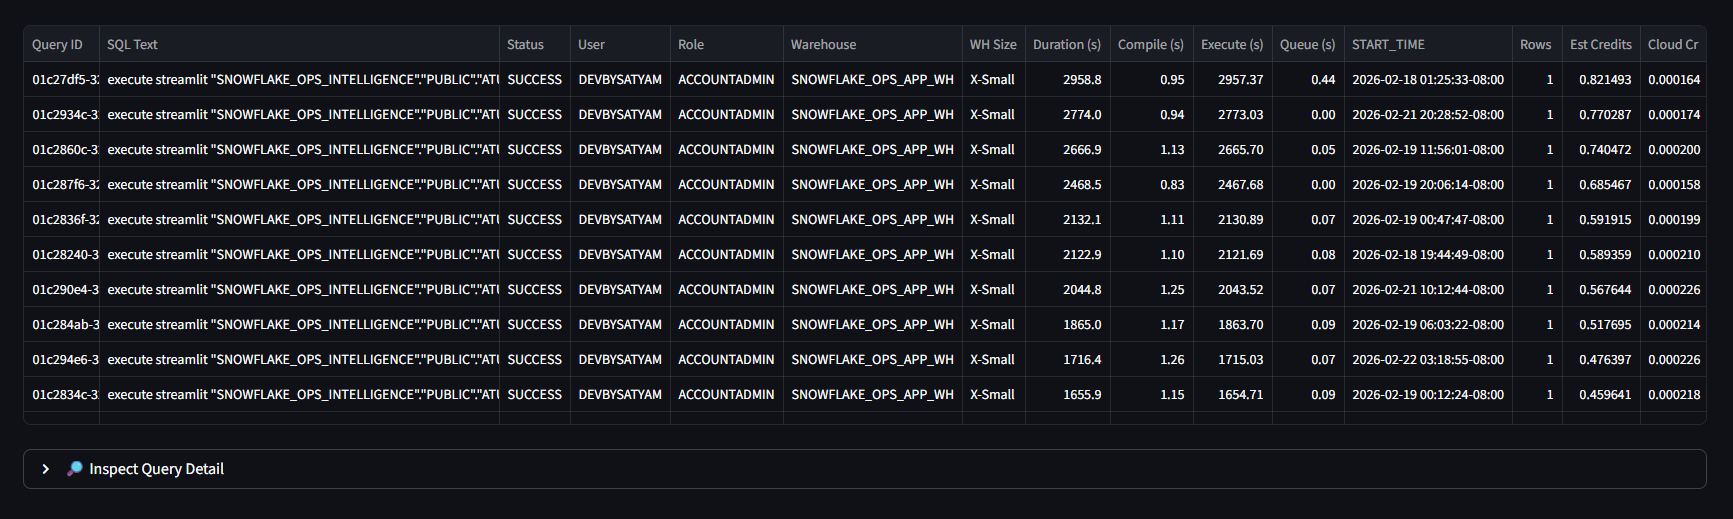
Ranked workloads by volume with average duration, user count, and warehouse mapping. Identifies the most resource-intensive operations.
2_queries.py
Pattern analysis and optimization recommendations.
2_queries.py → Intelligence
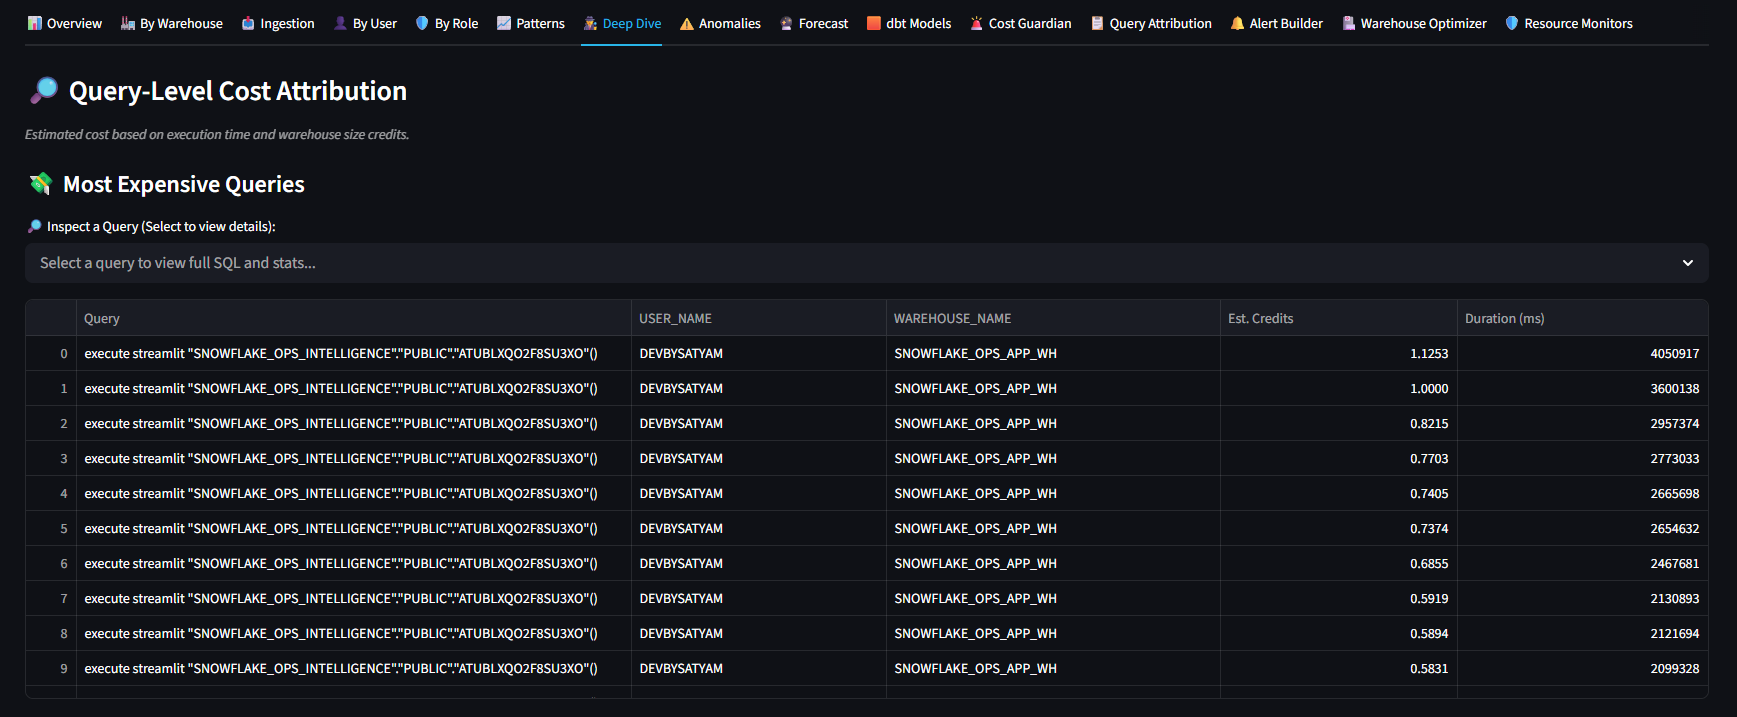
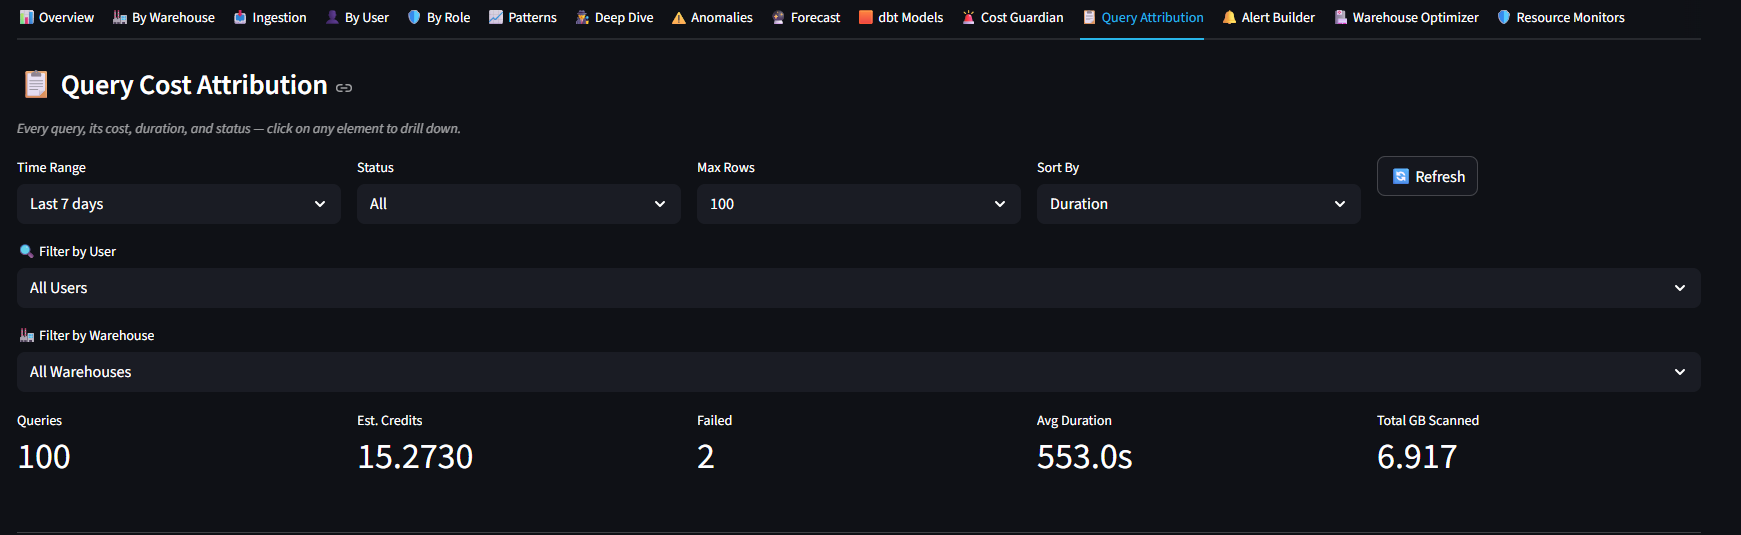
Map query costs to users, roles, and warehouses.
1_cost.py → Query Attribution
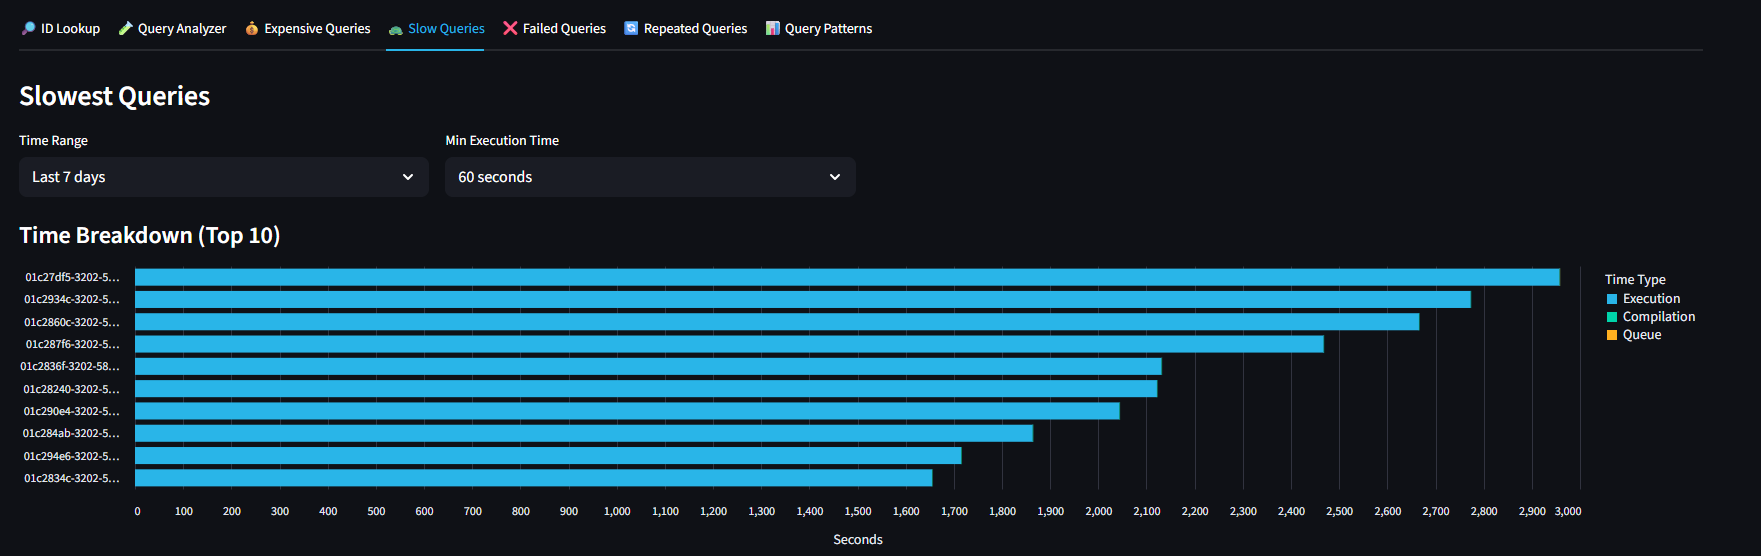
Identify and analyze the slowest running queries.
2_queries.py → Slow
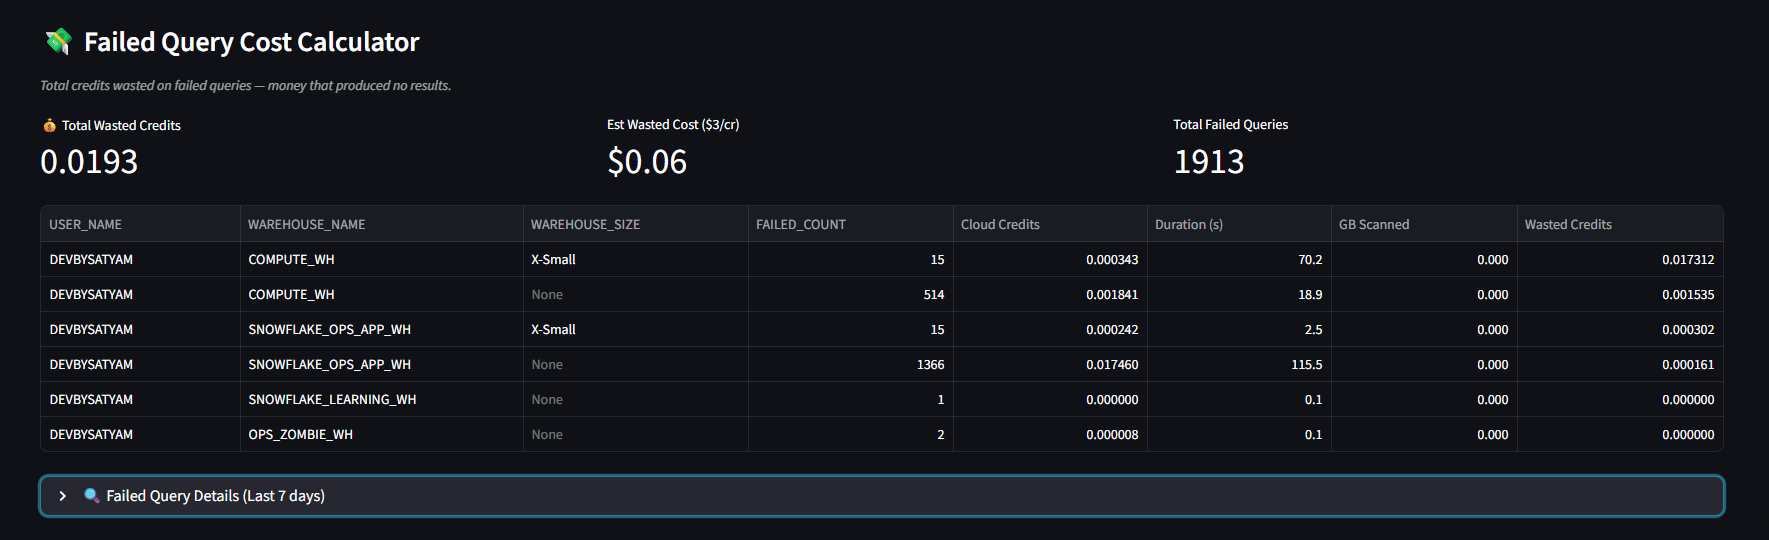
Track error patterns and failure rates across workloads.
2_queries.py → FailedWarehouse health scores, auto-suspend tuning, benchmark savings calculations, and cold asset detection.
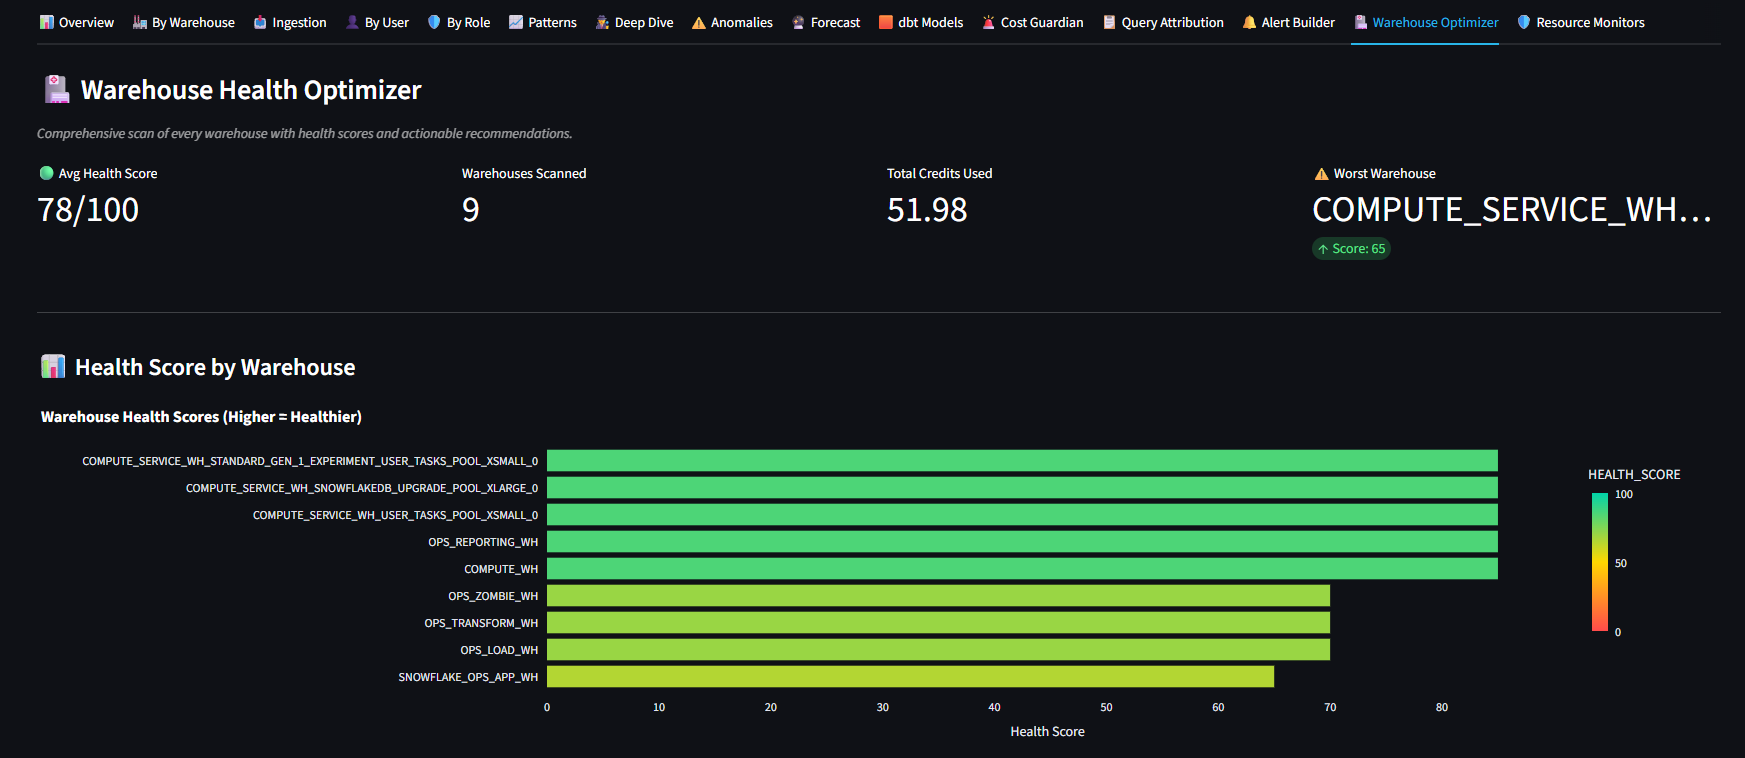
Health score per warehouse (higher = healthier). Color-coded bar chart from green (healthy) to yellow (needs attention). Average health score and total credits overview.
1_cost.py → Warehouse Optimizer
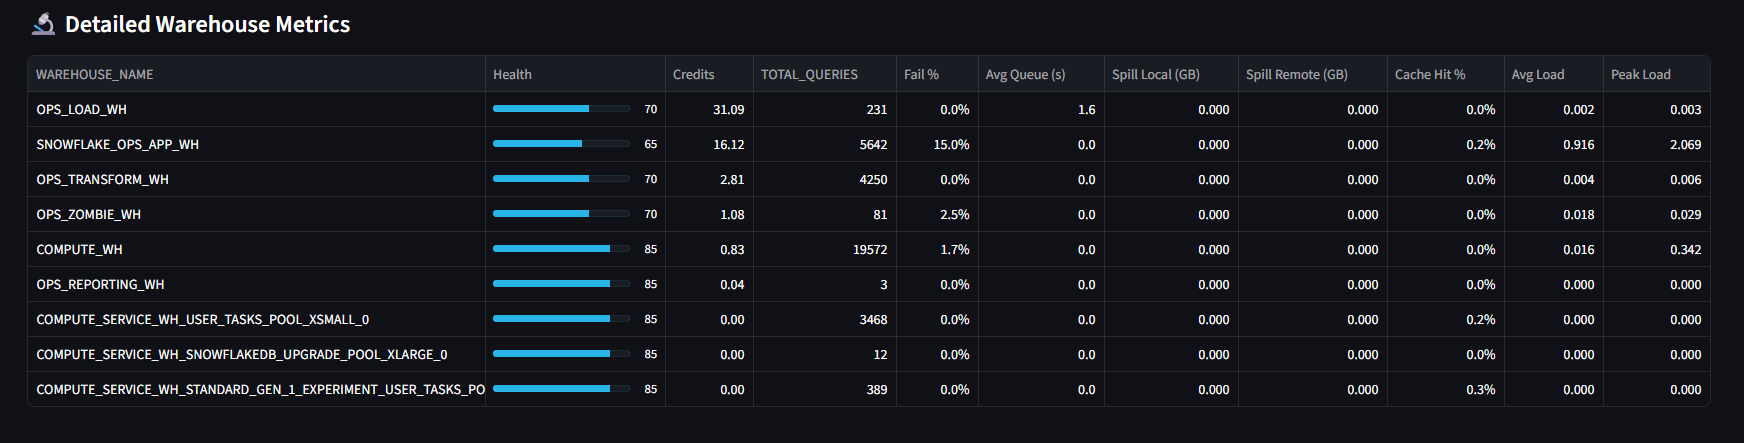
Detailed per-warehouse performance metrics and utilization.
warehouse_ops.py
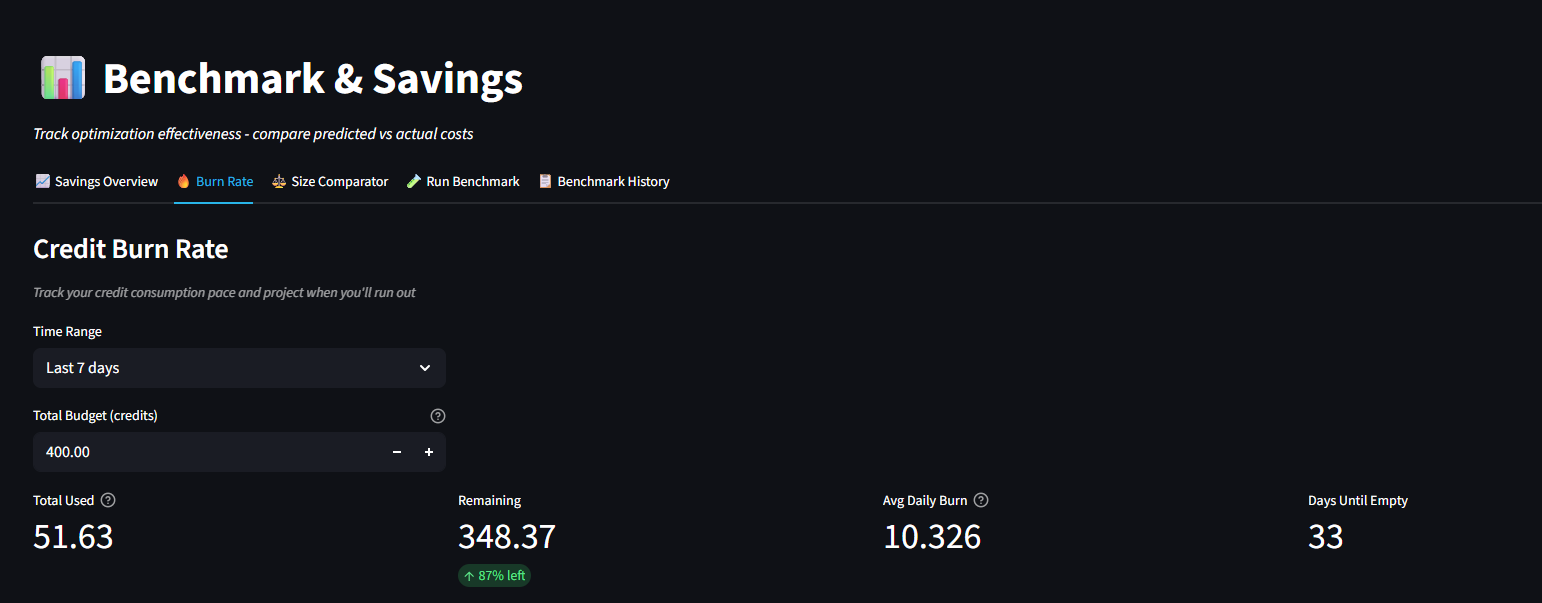
Calculate potential credit savings from optimization.
warehouse_ops.py → Savings
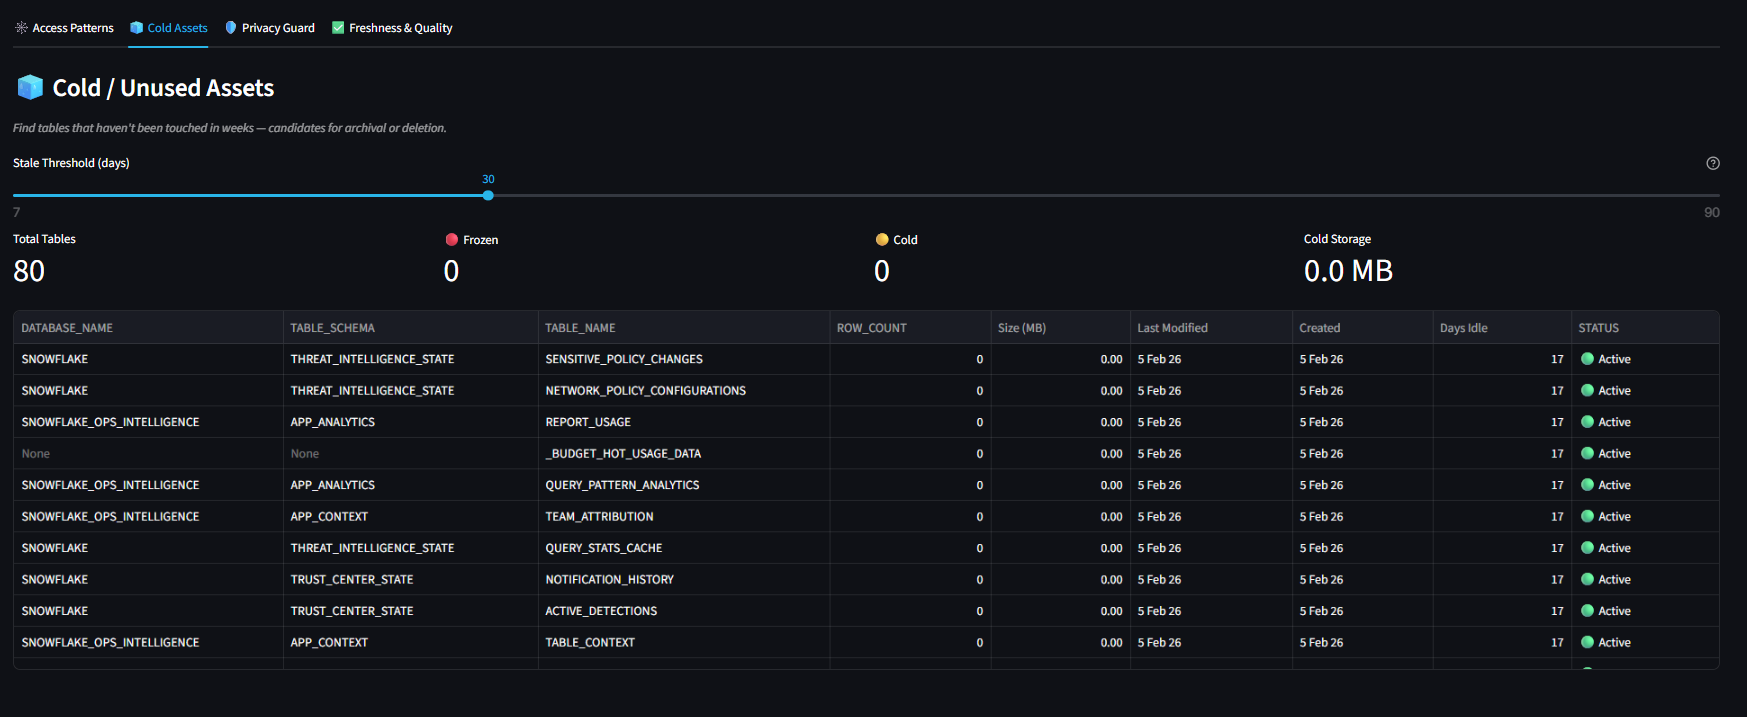
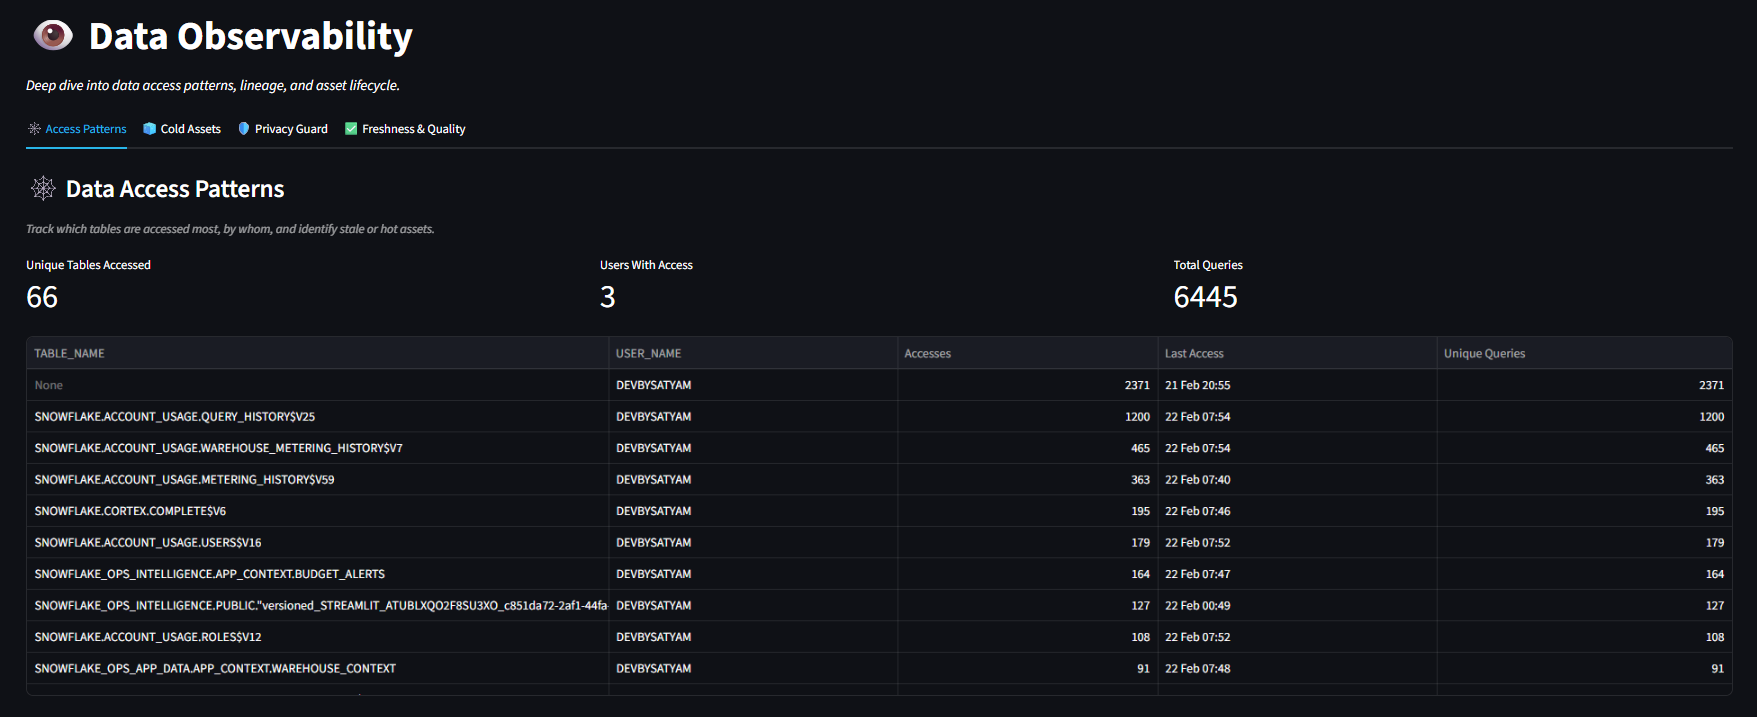
Identify unused tables, schemas, and warehouses consuming storage without active queries.
data_observability.pyNatural language analytics, autonomous agent builder, AI/BI dashboard creation, and SQL workbench.
Cost Flow Analysis — visualize how credits flow from total budget to individual warehouses using Sankey diagrams. Ask questions in plain English.
3_cortex.py
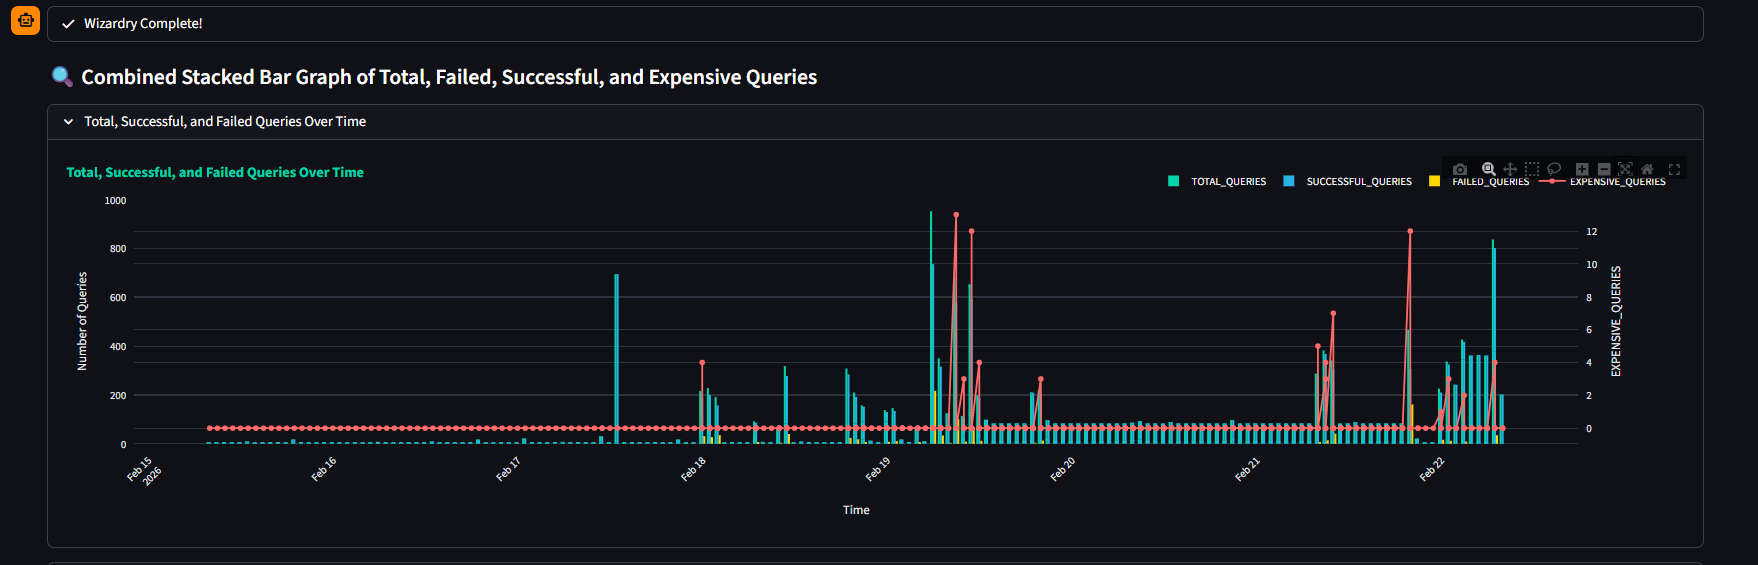
Automated analysis and visualization generation from natural language prompts.
cortex.py → Wizard
Generated charts and SQL from conversational queries.
cortex.py → Results
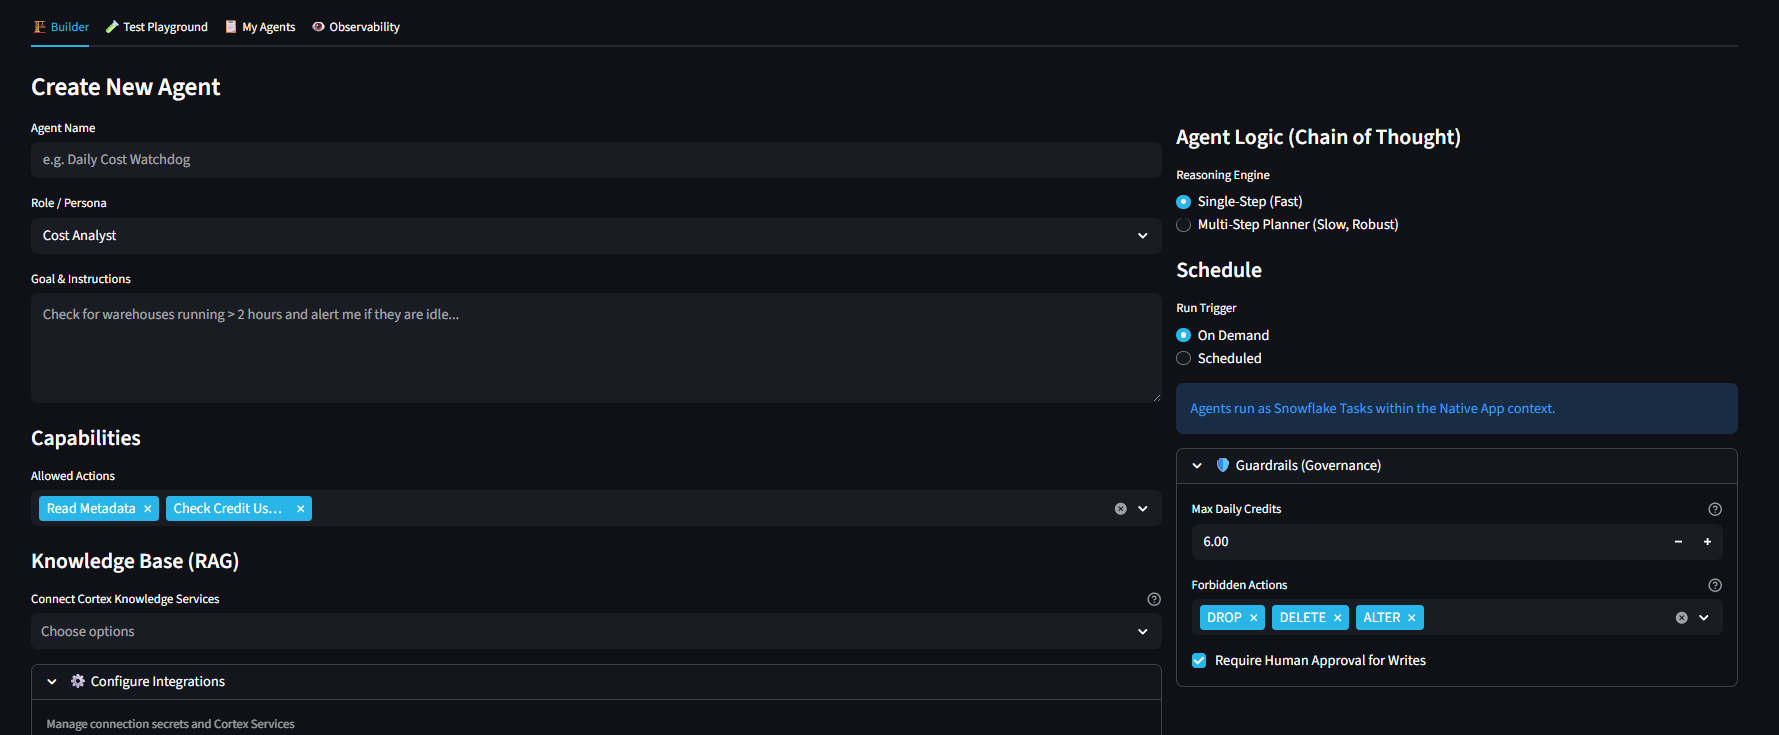
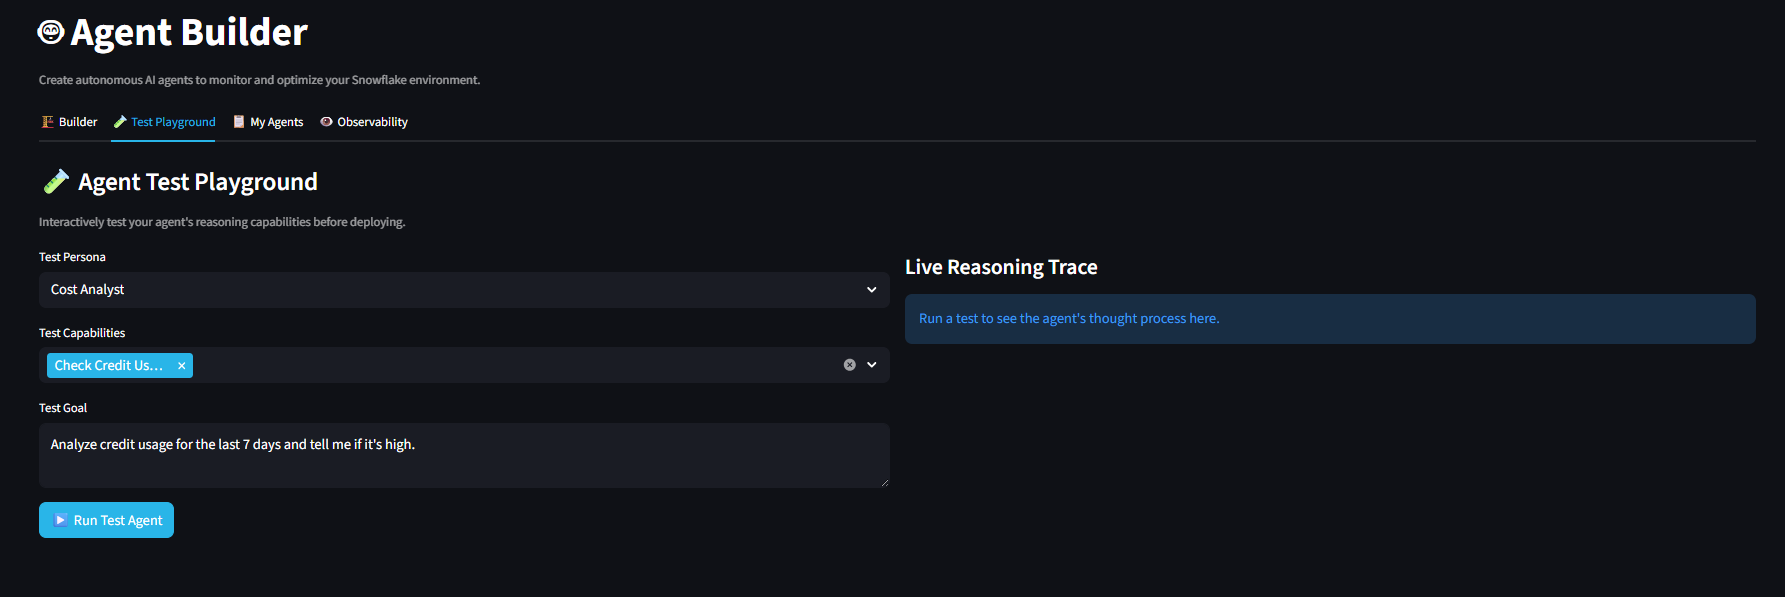
Create autonomous agents with RAG knowledge bases, guardrails, and governance controls. Agents run as Snowflake Tasks.
agent_builder.py
No-code dashboard assembly with drag-and-drop metric components.
4_builder.py
Built-in SQL editor with syntax highlighting, execution, and result visualization — directly inside the Streamlit app.
sql_workbench.pyAutomated compliance scoring, PII column detection, login forensics, and user risk assessment.
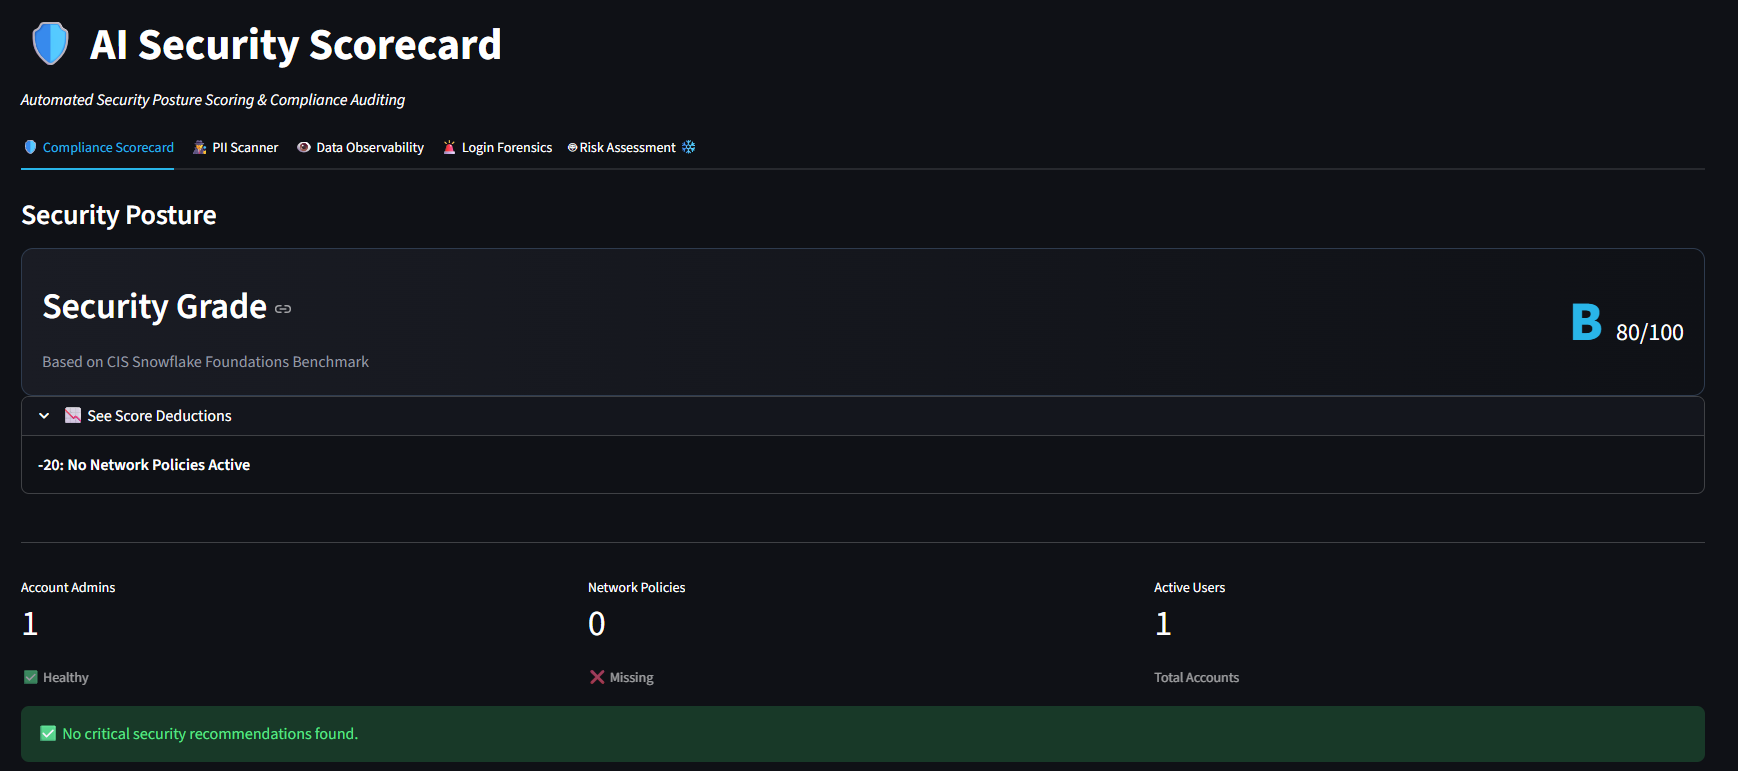
Security grade based on CIS Snowflake Foundations Benchmark. Score deductions shown with actionable recommendations. Account admins, network policies, and active users at a glance.
security_governance.py → Scorecard
Per-user security scoring with privilege analysis.
security → Users
Track policy enforcement actions and compliance status.
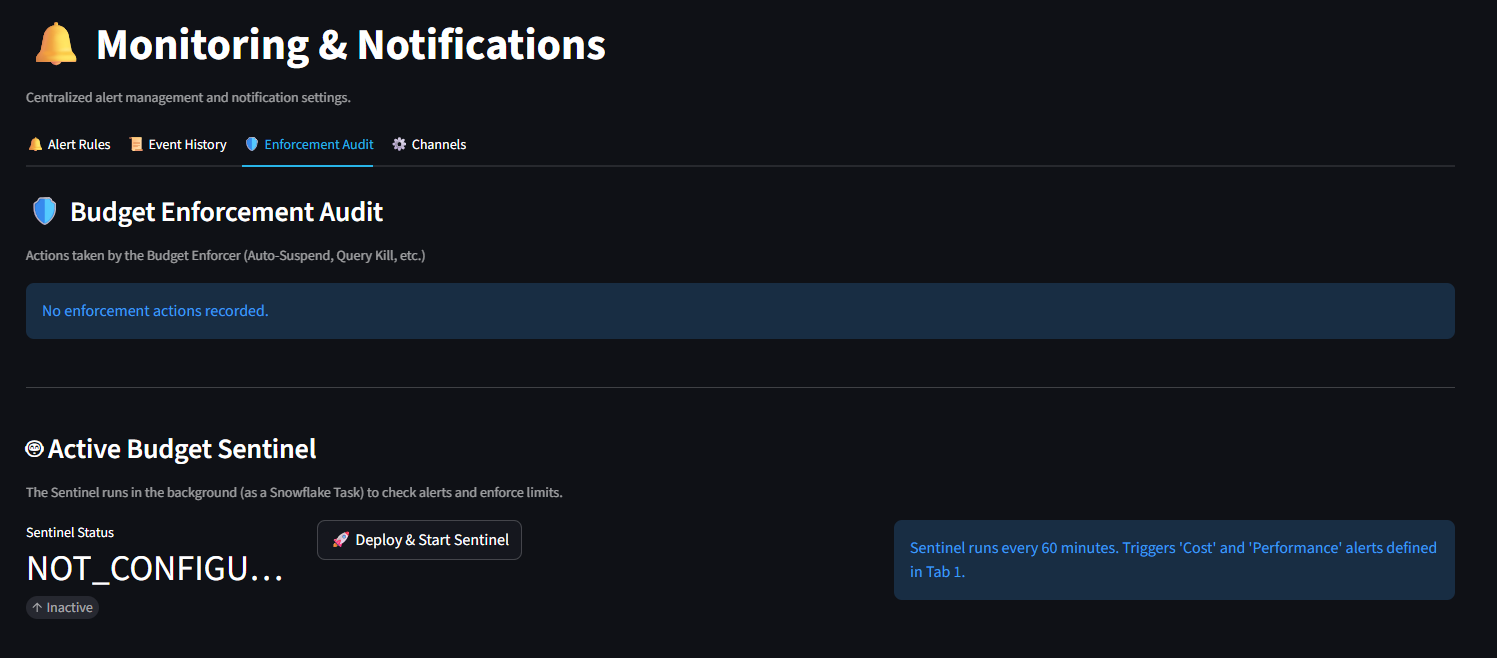
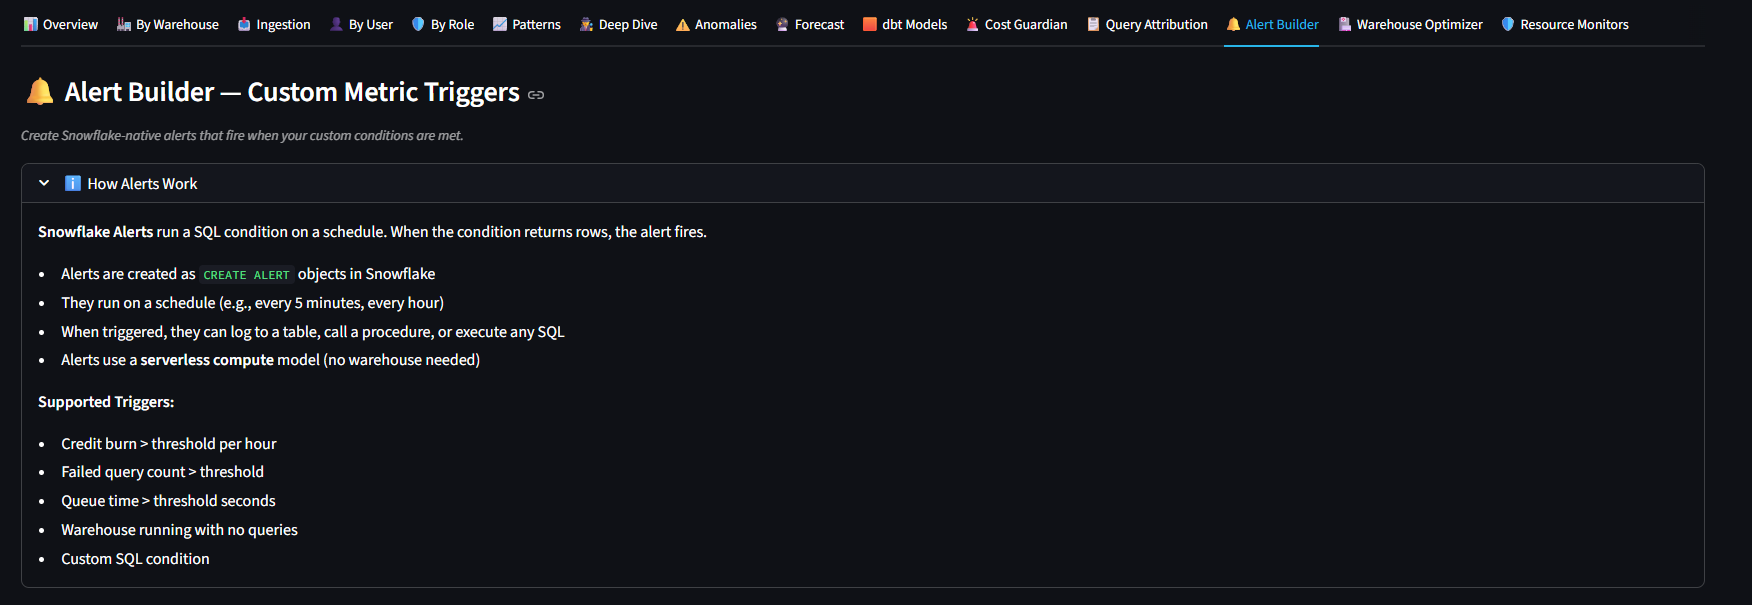
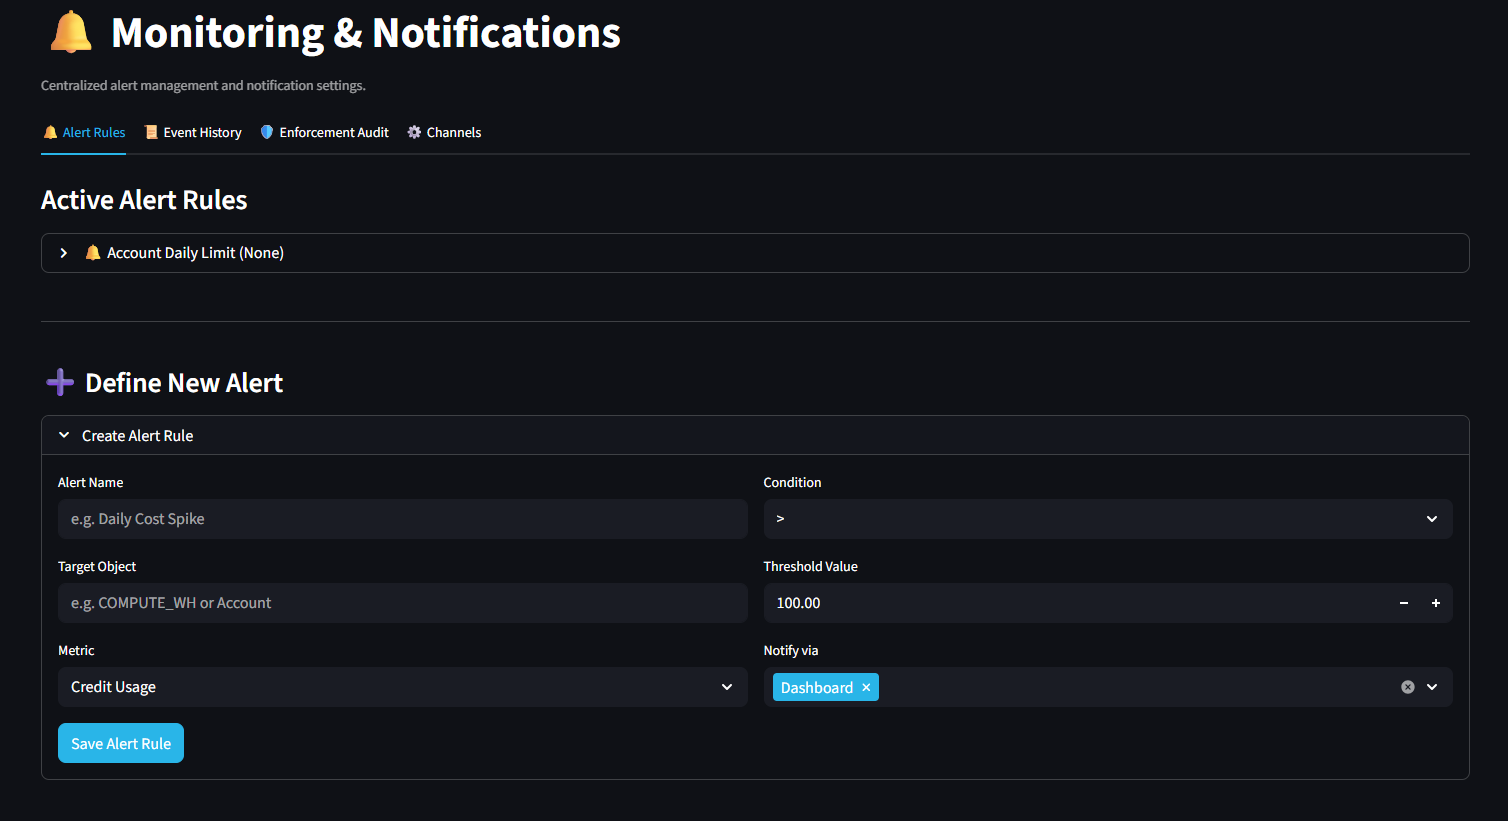
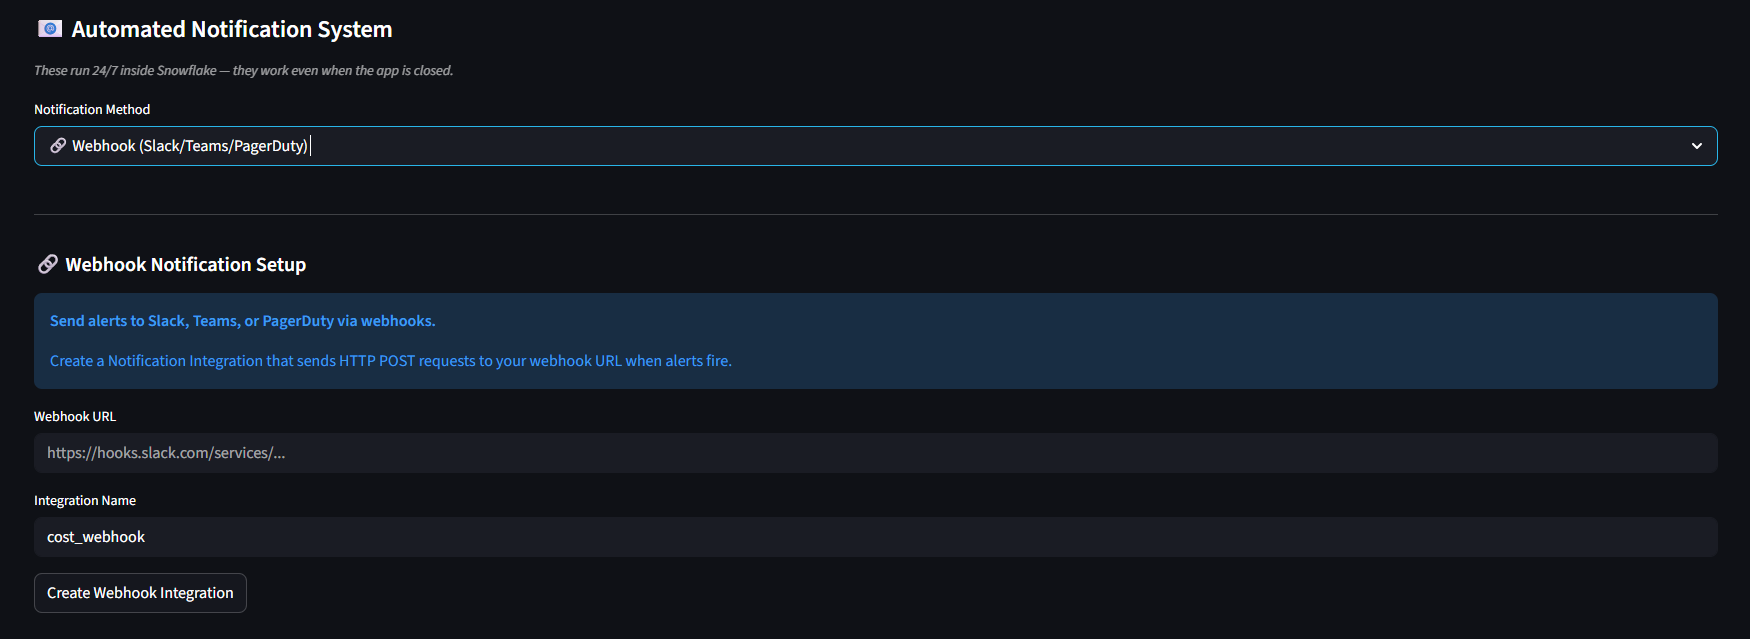
security → AuditSlack and Teams webhook integrations, custom alert rules, and monitoring dashboards.
Active alerts, triggered rules, and monitoring status overview.
alerts.py
Configure custom thresholds and notification channels.
alerts.py → Rules
Connect Slack, Teams, or custom API endpoints for automated notifications.
alert_agent.py → Webhooks
Monitor data freshness, pipeline health, and schema changes.
data_observability.py
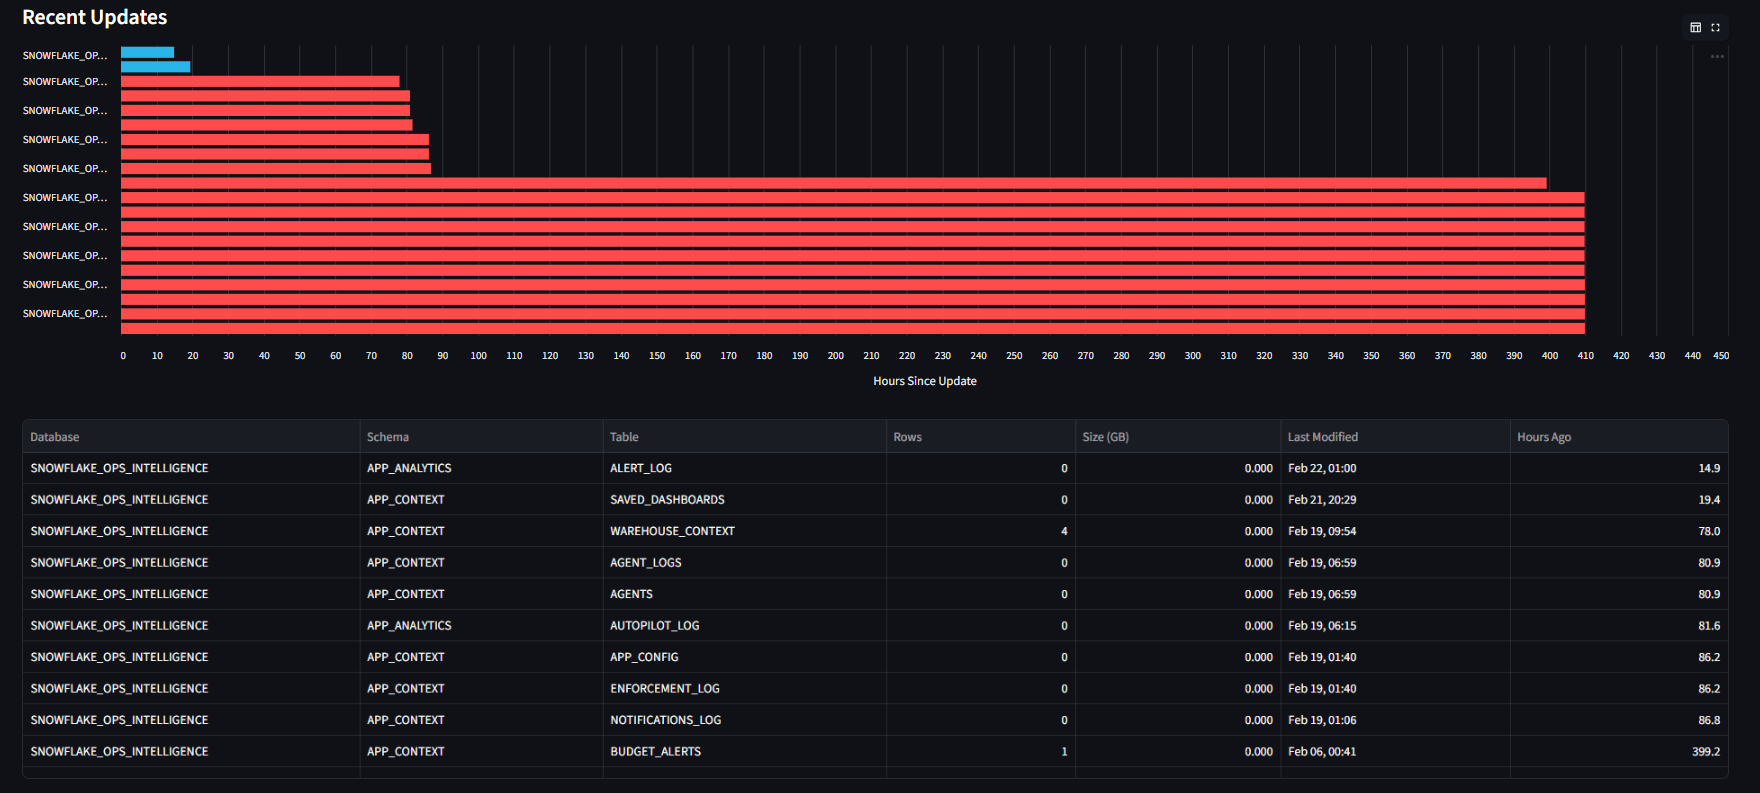
Track how up-to-date your tables and views are. Identify stale datasets before they impact downstream analytics.
data_observability.py → FreshnessDeploy the complete suite inside your Snowflake account in under 5 minutes. 100% free and open source.
Deploy SnowOps Now →